The composition of the Group’s eligible own funds is as follows:
| 31/12/2020 | 31/12/2019 | 31/12/2018 | ||||||||
| AMOUNT | AS % | AMOUNT | AS % | AMOUNT | AS % | |||||
| Net equity | 25,278 | 25,151 | 24,058 | |||||||
| Shareholders’ equity | 27,118 | 26,247 | 25,384 | |||||||
| Capital | 5,981 | 5,981 | 5,981 | |||||||
| Profit/(loss) | 1,381 | 1,705 | 1,985 | |||||||
| Reserves and other | 19,756 | 18,561 | 17,418 | |||||||
| Minority interests and OCI | (1,840) | (1,096) | (1,326) | |||||||
| Other CET1 instruments | 268 | (1,037) | (801) | |||||||
| Adjustments applied to the eligibility of minority interests and OCI | (107) | 6 | (43) | |||||||
| Other adjustments (1) | 375 | (1,043) | (758) | |||||||
| CET1 Instruments | 25,546 | 24,114 | 23,257 | |||||||
| Deductions from CET1 | (5,892) | (6,327) | (6,457) | |||||||
| Intangible assets | (3,873) | (4,232) | (4,250) | |||||||
| Deferred tax assets | (1,789) | (1,875) | (1,977) | |||||||
| Other deductions from CET1 | (230) | (220) | (230) | |||||||
| CET1 | 19,654 | 13.6% | 17,787 | 12.0% | 16,800 | 11.5% | ||||
| AT1 instruments (2) | 2,984 | 2,236 | 2,233 | |||||||
| AT1 Deductions | ||||||||||
| TIER 1 | 22,638 | 15.7% | 20,023 | 13.5% | 19,033 | 13.0% | ||||
| T2 instruments | 3,407 | 3,224 | 3,295 | |||||||
| T2 Deductions | ||||||||||
| TIER 2 | 3,407 | 2.4% | 3,224 | 2.2% | 3,295 | 2.3% | ||||
| TOTAL CAPITAL | 26,045 | 18.1% | 23,247 | 15.7% | 22,328 | 15.3% | ||||
| Other eligible subordinated instruments MREL (3) | 6,664 | 5,680 | 2,303 | |||||||
| SUBORDINATED MREL | 32,709 | 22.7% | 28,927 | 19.6% | 24,631 | 16.9% | ||||
| Other eligible instruments. MREL (4) | 5,111 | 3,362 | 2,943 | |||||||
| MREL (5) | 37,820 | 26.3% | 32,289 | 21.8% | 27,574 | 18.9% | ||||
| RISK WEIGHTED ASSETS (RWA) | 144,073 | 147,880 | 145,942 | |||||||
(1) Mainly includes the forecast for dividends, and IFRS 9 transitional adjustment.
(2) An AT1 issue of EUR 750 million was completed in October.
(3) An issue of EUR 1,000 million of Senior non-preferred debt was made in November.
(4) Two issues of EUR 1,000 million each of Senior preferred debt were made in 2020 (in January and July).
(5) In relation to the MREL requirement, the new recovery and resolution directive (BRRD2) provides that as from 1 January 2022, at consolidated level, CaixaBank must comply with a total MREL requirement of 22.09% of RWAs (16.26% with subordinated instruments) and 6.09% of leverage ratio exposure (LRE). In December 2020, the total MREL ratio reached 9.4% of LRE.
At individual level, at 31 December 2020, CaixaBank has the following ratios: CET1 15.1%, Tier 1 capital 17.4% and Total Capital 20.0%, with RWAs of EUR 132,806 million.
The following chart sets out a summary of the minimum requirements of eligible own funds:
| 31/12/2020 | 31/12/2019 | 31/12/2018 | ||||||||
| AMOUNT | AS % | AMOUNT | AS % | AMOUNT | AS % | |||||
| BIS III minimum requirements | ||||||||||
| CET1 (*) | 11,670 | 8.10% | 12,983 | 8.78% | 12,770 | 8.75% | ||||
| Tier 1 | 14,236 | 9.88% | 15,201 | 10.28% | 14,959 | 10.25% | ||||
| Total capital | 17,658 | 12.26% | 18,159 | 12.28% | 17,878 | 12.25% | ||||
(*) For 2020, and taking into account the anticipation by the ECB of article 104 of DRC V in relation to Pilar 2R, the ECB required CaixaBank to maintain – at consolidated level – a CET1 ratio of 8.10%. This comprised the general minimum requirement for Pillar 1 of 4.5%, a specific Pillar 2R requirement of 1.5% (0.84% of which must comply with CET1), a capital conservation buffer of 2.5%, an O-SII buffer of 0.25%, and a specific countercyclical capital buffer of 0.01%.
The same requirements for 2020 are upheld in 2021, but it must be borne in mind that the countercyclical capital buffer must be updated quarterly.
The following chart provides a breakdown of the leverage ratio:
| 31/12/2020 | 31/12/2019 | 31/12/2018 | |
| Exposure | 403,659 | 341,681 | 344,485 |
| Leverage ratio (Tier 1/Exposure) | 5.6% | 5.9% | 5.5% |
The changes in eligible own funds are as follows:
| 31/12/2020 | 31/12/2019 | ||||||
| AMOUNT | AS % | AMOUNT | AS % | ||||
| CET1 AT THE START OF THE YEAR | 17,787 | 12.0% | 16,800 | 11.5% | |||
| Changes in CET1 instruments | 1,432 | 856 | |||||
| Benefit | 1,381 | 1,705 | |||||
| Expected dividends | (216) | (897) | |||||
| Reserves | 386 | 303 | |||||
| Valuation adjustments and other (1) | (119) | (255) | |||||
| Changes in deductions from CET1 | 435 | 131 | |||||
| Intangible assets | 359 | 18 | |||||
| Deferred tax assets | 85 | 102 | |||||
| Other deductions from CET1 | (9) | 11 | |||||
| CET1 AT THE END OF THE YEAR | 19,654 | 13.6% | 17,787 | 12.0% | |||
| ADDITIONAL TIER 1 AT THE START OF THE YEAR | 2,236 | 1.5% | 2,233 | 1.5% | |||
| Changes in AT1 instruments (2) | 748 | 3 | |||||
| ADDITIONAL TIER 1 AT THE END OF THE YEAR | 2,984 | 2.1% | 2,236 | 1.5% | |||
| TIER 2 AT THE START OF THE YEAR | 3,224 | 2.2% | 3,295 | 2.3% | |||
| Changes in Tier 2 instruments | 183 | (71) | |||||
| TIER 2 AT THE END OF THE YEAR | 3,407 | 2.4% | 3,224 | 2.2% | |||
(1) Includes IFRS 9 transitional adjustment
(2) An AT1 issue of EUR 750 million was completed in October 2020.
The causative details of the main aspects of the financial year that have influenced the CET1 ratio are set out below:
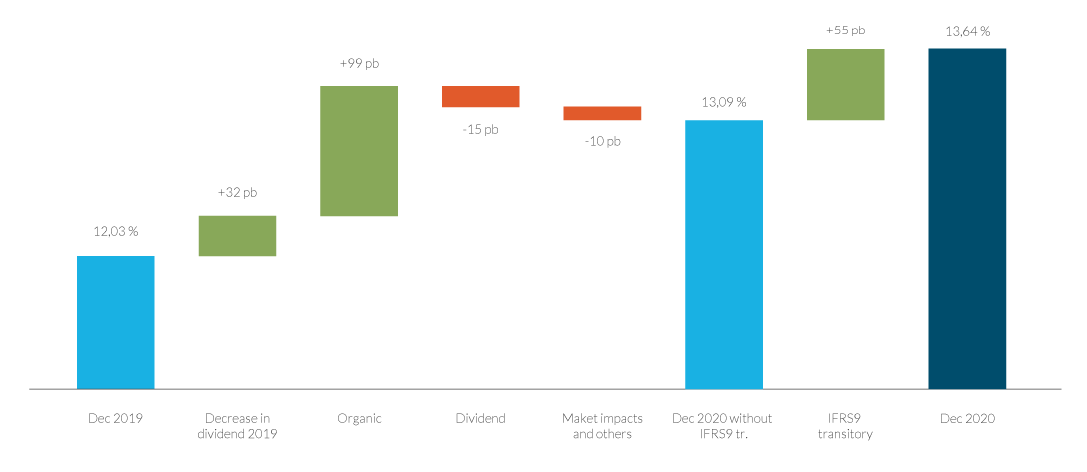
The increase of +161 basis points in the year, includes +32 basis points from the extraordinary impact of reducing the established dividend against 2019 earnings, as one of the measures adopted by the Board of Directors due to COVID-19, plus +55 basis points due to the adoption of the transitional period of IFRS 9.
The remaining accumulated performance is explained by +99 basis points due to the organic variation, -15 basis points from the forecast of dividends for the year and -10 basis points caused by the performance of the markets and other, which includes the impact of the partial sale of Comercia, the provision established on the interest held in Erste Group Bank and the new treatment of software coming into effect 10.
Information on capital requirements by risk calculation method is presented below:
| 31/12/2020 | 31/12/2019 | 31/12/2018 | ||||||||
| AMOUNT | % | AMOUNT | % | AMOUNT | % | |||||
| Credit risk (1) | 111,827 | 77.6% | 113,947 | 77.1% | 111,740 | 76.6% | ||||
| Standardised approach | 63,832 | 44.3% | 62,069 | 42.0% | 60,612 | 41.5% | ||||
| IRB approach | 47,995 | 33.3% | 51,878 | 35.1% | 51,128 | 35.0% | ||||
| Shareholder risk | 16,729 | 11.6% | 18,309 | 12.4% | 19,177 | 13.1% | ||||
| PD/LGD method | 4,056 | 2.8% | 5,915 | 4.0% | 7,436 | 5.1% | ||||
| Simple method | 12,673 | 8.8% | 12,394 | 8.4% | 11,709 | 8.0% | ||||
| VaR method | 0 | 0.0% | 0 | 0.0% | 32 | 0.0% | ||||
| Market risk | 2,267 | 1.6% | 2.224 | 1.5% | 1,916 | 1.3% | ||||
| Standardised approach | 1,158 | 0.8% | 1,232 | 0.8% | 1,177 | 0.8% | ||||
| Internal models (IMM) | 1,109 | 0.8% | 992 | 0.7% | 739 | 0.5% | ||||
| Operational risk | 13,250 | 9.2% | 13,400 | 9.1% | 13,109 | 9.0% | ||||
| Standardised approach | 13,250 | 9.2% | 13,400 | 9.1% | 13,109 | 9.0% | ||||
| TOTAL | 144,073 | 100.0% | 147,880 | 100.0% | 145,942 | 100.0% | ||||
(1) Includes credit valuation adjustments (CVA), deferred tax assets (DTAs) and securitisations.