3.3.1Business profitability risk
Business profitability risk refers to obtaining results lower than market expectations or the Group's targets which prevent the Group from reaching a profitability level that is higher than the cost of capital.
The profitability objectives, backed by financial planning and monitoring process, are set out in the Group's Strategic Plan, over three years, and are specified annually in the Group's budget and in the Business network challenges.
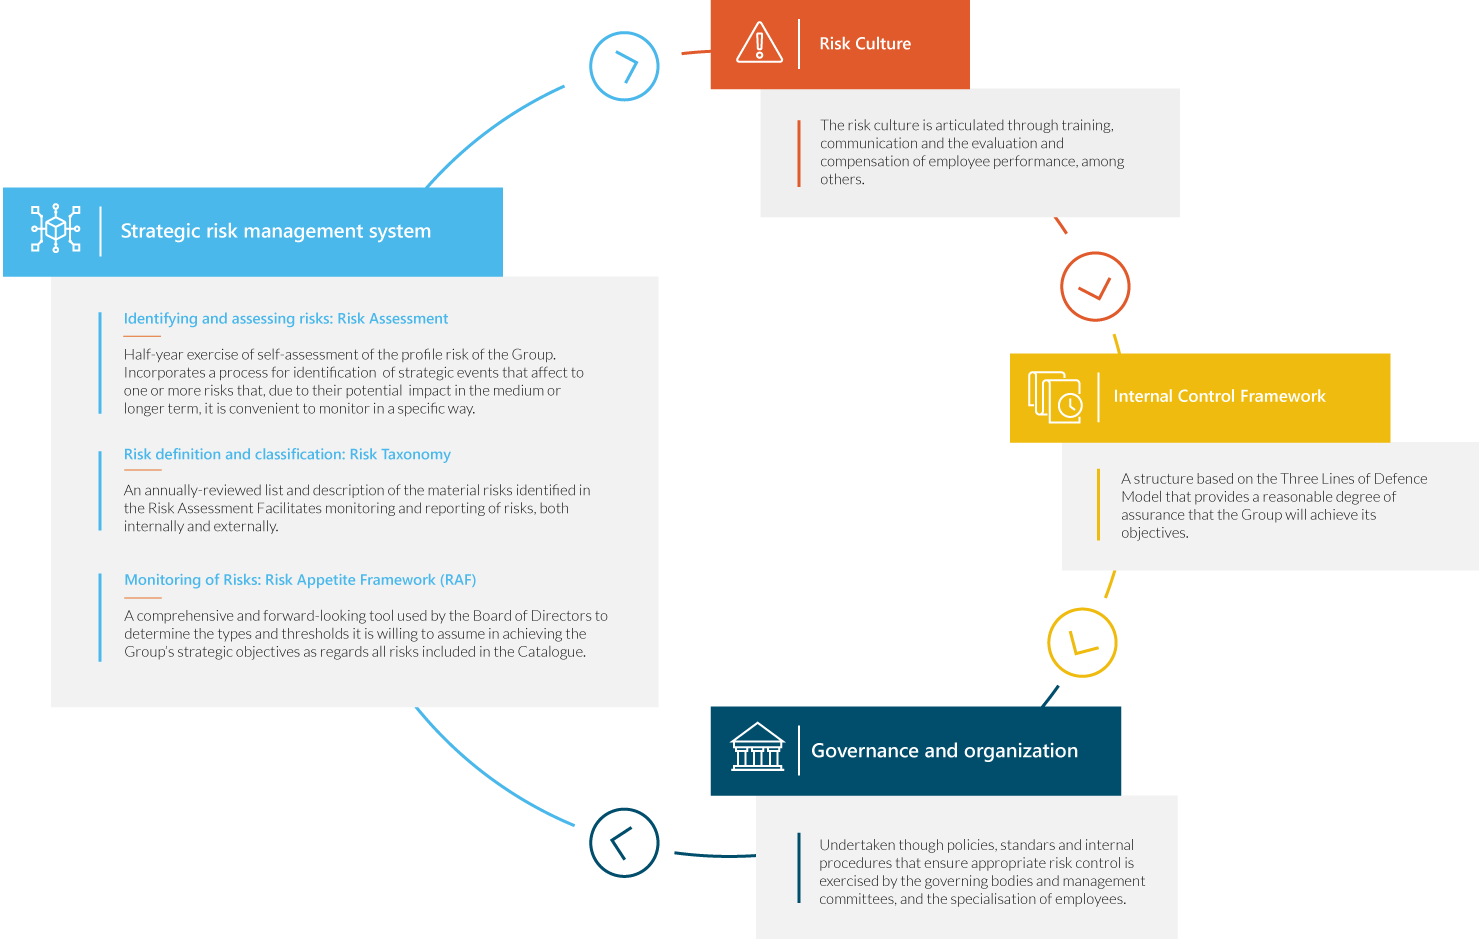
The Group has a corporate Policy for Business Profitability risk management. Management of this risk is founded on visions of management:
- Group vision: the overall aggregated return at the level of CaixaBank Group.
- Business/Region vision: the return from businesses/territories.
- Financial-Accounting vision: the return from different corporate businesses.
- Commercial-Management vision: the return from the management of the CaixaBank commercial network.
- Pricing vision: the return from setting prices for CaixaBank products and services.
- Project vision: the return from relevant Group projects.
The risk management strategy for business profitability is closely integrated with the capital adequacy and liquidity management strategy of the Group, and is supported by the strategic risk processes (Corporate Risk Catalogue, risk assessment and RAF).
3.3.2 Risk of own funds and capital adequacy
The risk of own funds and capital adequacy responds to the potential restriction of the Group to adapt its volume of own funds to regulatory requirements or a change to its risk profile.
The Group has set an objective of maintaining a medium-low risk profile and a comfortable level of capital to strengthen its position. Capital adequacy to cover eventual unexpected losses is measured from two different perspectives and using different methodologies: regulatory capital and economic capital.
The regulatory capital of financial institutions is regulated by Regulation 575/2013 (CRR) and Directive 2013/36/EU of the European Parliament and of the Council (CRD 4), which implemented the Basel III regulatory framework (BIS III) in the European Union. Whereas the CRR was directly applied in Spain, CRD 4 was transposed to Spanish law through Act 10/2014 on the arrangement, monitoring and solvency of credit institutions and its subsequent regulatory development through Royal Decree 84/2015 and Bank of Spain Circular 2/2016. Regulatory capital is the metric required by regulators and used by analysts and investors to compare financial institutions. Similarly, following the transposition to European legislation in 2013, the Basel Committee and other relevant bodies published a series of additional rules and documents containing new specifications for the calculation of capital. This means that procedures are constantly being updated, and therefore the Group continuously adapts its processes and systems to ensure the calculation of capital consumption and deductions from own funds are fully aligned with the new established requirements.
In 2016, an amendment process was undertaken on the CRR and CRD 4, which led to the entry into force, in 2019, of CRR 2 and CRD 5. The generalised applicability of CRR 2 is planned for June 2021.
Meanwhile, the economic capital measures the internal criteria for own funds and capital requirements for all risks derived from its activity. This measure complements the regulatory vision of capital adequacy, allows for it to better offset the risk assumed by the Entity and includes risks that have not been factored in at all or only partially by the regulatory measures. This vision is used for i) the self-assessment of capital, subject to presentation and periodical review in the Group's corresponding bodies; ii) as a control and monitoring tool; iii) risk planning and iv) calculating Risk-Adjusted Return (RAR) and Pricing. In contrast with regulatory capital, economic capital is an internal estimate which is adjusted according to the level of tolerance to risk, volume, and type of business activity.
In addition to the risks referred to in Pillar I (credit, market and operational risk), it includes others also included in the Corporate Risk Catalogue , (e.g. interest rate risk in the banking book, and liquidity, business and actuarial risk, etc.).
In addition, the regime under Directive 2014/59/EU (BRRD) and Regulation 806/2014/EU (SRM) of the European Parliament and of the Council establishing a framework for the recovery and resolution of credit institutions and investment firms, implemented in Spain through Act 11/2015 and Royal Decree 1012/2015, requires that banks must have minimum eligible capital and liabilities (MREL). The application of this regulatory reform has led the MREL requirement to be expressed as a percentage of risk-weighted assets and of exposure for the calculation of the leverage ratio.
The Group has a Corporate Policy for Own Funds and Capital Adequacy Risk that covers a broad concept of own funds, including both eligible own funds under prudential regulations and eligible instruments for hedging MREL minimum requirements, the purpose of which is to lay down the principles on which capital objectives are determined in CaixaBank Group, as well as to lay down a common set of guidelines in relation to the monitoring, control and management of own funds that allow this risk to be mitigated, among other aspects. Similarly, the main processes comprising the management and control of capital adequacy and own funds risk are as follows: i) ongoing measurement and internal and external reporting on regulatory capital and economic capital through relevant metrics; ii) capital planning in different scenarios (standardised and stress scenarios, including ICAAP, EBA Stress Test and Recovery Plan), integrated in the corporate financial planning process, which includes the projection of the Group's balance sheet, income statement, capital requirements and own funds and capital adequacy. All of this is accompanied by monitoring of the capital regulations applicable at present and over the coming years.
For further information on the risk management of own funds and capital adequacy, see Note 4 - Capital Adequacy Management.
3.3.3 Liquidity and funding risk
Overview
Liquidity and financing risk refers to insufficient liquid assets or limited access to market financing to meet contractual maturities of liabilities, regulatory requirements, or the investment needs of the Group.
The Group manages this risk in order to ensure liquidity is maintained at levels that allow it to comfortably meet all its payment obligations and to prevent its investment activities from being affected by a lack of lendable funds, operating at all times within the Risk Appetite Framework (RAF). The strategic principles to achieve the liquidity management objectives are as follows:
- A decentralised liquidity management system across three units (the CaixaBank subgroup, the BPI subgroup and CaixaBank Wealth Management Luxembourg, S.A.), which includes a segregation of duties to ensure optimal management, control and monitoring of risks.
- Maintaining an efficient level of liquid funds in order to meet obligations assumed, fund business plans and comply with regulatory requirements.
- Active management of liquidity through ongoing monitoring of liquid assets and the balance sheet structure.
- Sustainability and stability as principles of the funding source strategy, which is based on i) the customer deposit-based funding structure and ii) capital market funding, complementing the funding structure.
The liquidity risk strategy and appetite for liquidity and financing risk involves:
- Identifying material liquidity risks for the Group and its liquidity management units;
- Formulating the strategic principles the Group must observe in managing each of these risks;
- Establishing the relevant metrics for each of these risks;
- Setting appetite, tolerance, limit and – as the case may be – recovery thresholds within the RAF;
- Setting up management and control procedures for each of the risks, including mechanisms for internal and external systematic monitoring;
- Defining a stress testing framework and a Liquidity Contingency Plan to ensure Liquidity risk can be appropriately managed in moderate and severe crisis situations;
- And a Recovery Planning framework, in which scenarios and measures are devised for stress conditions.
In particular, the Group holds specific strategies with regard to: i) management of intraday liquidity risk; ii) management of the short-term liquidity; iii) management of sources of financing/concentrations; iv) management of liquid assets; and v) management of collateralised assets. Similarly, the Group has procedures to minimise liquidity risks in stress conditions through i) the early detection of the circumstances through which it can be generated; ii) minimising negative impacts; and iii) sound management to overcome a potential crisis situation.
Mitigation techniques for liquidity risk
On the basis of the principles mentioned in the previous section, a Contingency Plan has been drawn up defining an action plan for each of the established crisis scenarios. This sets out measures to be taken on the commercial, institutional and disclosure level to deal with this kind of situation, including the possibility of using the liquidity reserves or extraordinary sources of finance. In the event of a situation of stress, the liquid asset buffer will be managed with the objective of minimising liquidity risk.
The measures in place for liquidity risk management and anticipatory measures feature:
- Delegation of the Annual General Meeting or, where applicable, of the Board of Directors for issuance, depending on nature of the type of instrument.
- Availability of several facilities open with i) the ICO, under credit facilities – mediation, ii) the European Investment Bank (EIB) and iii) the Council of Europe Development Bank (CEB). In addition, there are financing instruments with the ECB for which a number of guarantees have been posted to ensure that liquidity can be obtained immediately:
Available in ECB facility (Millions of euros)
| |
31/12/2020 |
31/12/2019 |
31/12/2018 |
| Value of guarantees delivered as collateral |
72,139 |
51,455 |
53,652 |
| CaixaBank |
66,498 |
46,001 |
46,698 |
| BPI |
5,641 |
5,454 |
6,954 |
| Drawn down |
(49,725) |
(12,934) |
(28,183) |
| TLTRO II – CaixaBank |
|
(3,409) |
(26,819) |
| TLTRO III – CaixaBank * |
(45,305) |
(8,145) |
|
| TLTRO II – BPI |
|
(500) |
(1,364) |
| TLTRO III – BPI * |
(4,420) |
(880) |
|
| Interest on drawn guarantees |
122 |
49 |
279 |
| Interest on drawn guarantees - CaixaBank |
122 |
44 |
268 |
| Interest on drawn guarantees - BPI |
|
6 |
11 |
| TOTAL AVAILABLE BALANCE IN ECB FACILITY |
22,536 |
38,571 |
25,748 |
|
|
|
|
(*) Interest accrued from the borrowing from TLTRO III on 31 December 2020 amounts to EUR 288 million. This interest is calculated for each operation of this series and reflects the Group's estimation in the initial recognition with respect to the amount of final interest to charge upon its specific maturity, taking into account specific hypotheses of fulfilment of eligible volumes. The value "interest on drawn guarantees" is the calculation carried out by the Bank of Spain to assess the guarantees drawn in the facility. In the calculation of the balance available in the facility at 31 December 2020, Bank of Portugal does not calculate the interest on guarantees drawn.
In TLTRO III fixed-term monetary policy financing operations, there are preferential financing interest rates on condition of fulfilling variations in the admissible credit during certain periods. There are two periods in which it is close finalising (from 1 April 2019 to 31 March 2021 and 1 March 2020 to 31 March 2021) for those that have produced growth above the required threshold. In the period that recently began (ranging from 1 October 2020 to 31 December 2021), growth is expected above the established threshold to obtain the preferential rate.
- Maintaining issuance programmes aimed at expediting formalisation of securities issuances in the market.
Debt issuance capacity - 31 - 12 - 2020 (Millions of euros)
| |
TOTAL ISSUANCE CAPACITY |
TOTAL ISSUED |
| CaixaBank promissory notes programme (CNMV 09-07-2020) (1) |
1,000 |
0 |
| CaixaBank fixed-income programme (CNMV 09-07-2020) |
15,000 |
0 |
| CaixaBank EMTN ("Euro Medium Term Note") programme (Ireland 23-04-2020) |
25,000 |
14,629 |
| BPI EMTN ("Euro Medium Term Note") programme (Luxembourg 21-07-2020) |
7,000 |
1,025 |
| CaixaBank ECP ("Euro Commercial Paper") programme (Ireland 15-12-2020) |
3,000 |
650 |
| BPI mortgage covered bonds programme (CMVM Portugal 02-07-2020) |
9,000 |
7,300 |
| BPI public sector covered bonds programme (CMVM Portugal 20-08-2020) |
2,000 |
600 |
(1) Programme extendible to EUR 3,000 million
- Capacity to issue backed bonds
Covered bond issuance capacity - 31-12-2020 (Millions of euros)
| |
ISSUANCE CAPACITY |
TOTAL ISSUED |
| Mortgage covered bonds |
3,063 |
48,233 |
| Public sector covered bonds |
5,159 |
3,500 |
To facilitate access to short-term markets, CaixaBank currently maintains the following:
- Interbank facilities with a significant number of (domestic and foreign) banks, as well as central banks.
- Repo facilities with a number of domestic and foreign counterparties.
- Access to central counterparty clearing houses for repo business (LCH SA – Paris, BME – Madrid and EUREX – Frankfurt).
The Contingency Plan and Recovery Plan contain a wide range of measures that allow for liquidity to be generated in a wide range of crisis situations. These include potential issuances of secured and unsecured debt, use of the repo market, and so on. For all these, viability is assessed under different crisis scenarios and descriptions are provided of the steps necessary for their execution and the expected period of execution.
Liquidity situation
The following table presents a breakdown of the Group's liquid assets based on the criteria established for determining high-quality liquid assets to calculate the LCR (HQLA) and assets available in facility not considered HQLAs:
Liquid assets *(Millions of euros)
| |
31/12/2020 |
|
31/12/2019 |
|
31/12/2018 |
| |
MARKET VALUE |
APPLICABLE WEIGHTED AMOUNT |
|
MARKET VALUE |
APPLICABLE WEIGHTED AMOUNT |
|
MARKET VALUE |
APPLICABLE WEIGHTED AMOUNT |
| Level 1 assets |
94,315 |
94,280 |
|
53,098 |
53,021 |
|
54,841 |
54,771 |
| Level 2A assets |
344 |
292 |
|
42 |
36 |
|
51 |
43 |
| Level 2B assets |
1,590 |
795 |
|
3,670 |
1,960 |
|
4,308 |
2,279 |
| TOTAL HIGH-QUALITY LIQUID ASSETS (HQLAS) (1) |
96,249 |
95,367 |
|
56,810 |
55,017 |
|
59,200 |
57,093 |
| Assets available in facility not considered HQLAs |
|
19,084 |
|
|
34,410 |
|
|
22,437 |
| TOTAL LIQUID ASSETS |
|
114,451 |
|
|
89,427 |
|
|
79,530 |
(*) Assets under the calculation of the LCR (Liquidity Coverage Ratio). It corresponds to high-quality liquid assets available to meet liquidity needs for a 30 calendar day stress scenario.
The Group's liquidity and financing ratios are set out below:
LCR and NSFR (Millions of euros)
| |
31/12/2020 |
31/12/2019 |
31/12/2018 |
| High-quality liquid assets - HQLAs (numerator) |
95,367 |
55,017 |
57,093 |
| Total net cash outflows (denominator) |
34,576 |
30,700 |
28,602 |
|
Cash outflows |
42,496 |
36,630 |
33,819 |
|
Cash inflows |
7,920 |
5,931 |
5,217 |
| LCR (LIQUIDITY COVERAGE RATIO) (%) (1) |
276% |
179% |
200% |
| NSFR (NET STABLE FUNDING RATIO) (%) (2) |
145% |
129% |
117% |
(1) LCR: regulatory ratio whose objective is to maintain an adequate level of high-quality assets available to cover liquidity needs with a 30-day horizon, under a stress scenario that considers a combined crisis of the financial system and reputation.
According to Commission Delegated Regulation (EU) 2015/61 of 10 October 2014 (and its amendment in Delegated Regulation (EU) 2018/1620 of July 2018), supplementing Regulation (EU) No 575/2013 of the European Parliament and of the Council with regard to the liquidity coverage requirement for credit institutions. The established regulatory limit for the LCR is 100%.
Segons el Reglament Delegat (UE) 2015/61 de la Comissió, de 10 d'octubre de 2014 (i la seva modificació en el Reglament Delegat (UE) 2018/1620, de juliol de 2018), pel qual es completa el Reglament (UE) n. 575/2013 del Parlament Europeu i del Consell respecte al requisit de cobertura de liquiditat aplicable a les entitats de crèdit. El límit regulatori de la ràtio LCR és del 100 %.
(2) NSFR – regulatory balance sheet structure ratio that measures the ratio between the quantity of available stable funding (ASF) and the quantity of required stable funding (RSF). Available stable funding is defined as the proportion of own funds and customer funds that are expected to be stable in the time horizon of one year. The amount of stable funding required by an institution is defined in accordance with its liquidity and the residual maturities of its assets and its balance sheet positions.
Calculations at 31-12-2020 and 31-12-2019, applying the regulatory criteria established in Regulation (EU) 2019/876 of the European Parliament and of the Council, of 20 May 2019, which will come into force in June 2021. The aforementioned calculations follow the criteria laid down by Basel. The regulatory limit established for the NSFR is 100% from June 2021.
Càlculs de 31-12-2020 i 31-12-2019 aplicant els criteris regulatoris establerts en el Reglament (UE) 2019/876 del Parlament Europeu i del Consell, de 20 de maig de 2019, que entra en vigor el juny de 2021. Els càlculs anteriors segueixen els criteris establerts per Basilea. El límit regulatori establert per a la ràtio NSFR és del 100 % a partir de juny de 2021.
Key credit ratings are displayed below:
Caixabank credit ratings
| |
LONG-TERM DEBT |
SHORT-TERM DEBT |
OUTLOOK |
SENIOR PREFERRED DEBT |
REVIEW DATE |
MORTGAGE COVERED BONDS |
| S&P Global Ratings |
BBB+ |
A-2 |
Stable |
BBB+ |
23/09/2020 |
AA |
| Fitch Ratings |
BBB+ |
F2 |
Negative |
A- |
29/09/2020 |
|
| Moody's Investors Service |
Baa1 |
P-2 |
Stable |
Baa1 |
22/09/2020 |
Aa1 |
| DBRS Morningstar |
A |
R-1(low) |
Stable |
A |
30/03/2020 |
AAA |
In the event of a downgrade of the current credit rating, additional collateral must be delivered to certain counterparties, or there are early redemption clauses. The breakdown of the impact on liquidity deriving from 1, 2 and 3-notch downgrading is shown below:
Sensitivity of liquidity to variations in the credit rating (Millions of euros)
| |
1-NOTCH DOWNGRADE |
2-NOTCH DOWNGRADE |
3-NOTCH DOWNGRADE |
| Trading in derivatives / repos (CSA / GMRA / GMSLA agreements) (*) |
0 |
6 |
6 |
| Deposits taken with credit institutions (*) |
0 |
667 |
667 |
(*) The balances presented are accumulated for each rating reduction.
Asset encumbrance – assets received and delivered under guarantee
Assets securing certain financing transactions and unencumbered assets are as follows:
Assets securing financing operations and unencumbered assets (Millions of euros)
| |
31/12/2020 |
|
31/12/2019 |
|
31/12/2018 |
| |
CARRYING AMOUNT OF COMMITTED ASSETS |
CARRYING AMOUNT OF NON-COMMITTED ASSETS |
|
CARRYING AMOUNT OF COMMITTED ASSETS |
CARRYING AMOUNT OF NON-COMMITTED ASSETS |
|
CARRYING AMOUNT OF COMMITTED ASSETS |
CARRYING AMOUNT OF NON-COMMITTED ASSETS |
| Equity instruments |
0 |
1,849 |
|
0 |
3,063 |
|
0 |
4,144 |
| Debt securities * |
8,040 |
35,377 |
|
5,248 |
28,887 |
|
8,314 |
27,969 |
| Of which: covered bonds |
6 |
3 |
|
2 |
9 |
|
5 |
4 |
| Of which: asset-backed securities |
0 |
70 |
|
0 |
92 |
|
0 |
0 |
| Of which: issued by public administrations |
6,802 |
31,152 |
|
4,584 |
24,161 |
|
7,222 |
24,564 |
| Of which: issued by financial corporations |
910 |
1,451 |
|
417 |
1,396 |
|
906 |
1,272 |
| Of which: issued by non-financial corporations |
323 |
2,701 |
|
245 |
3,228 |
|
181 |
2,129 |
| Other assets ** |
90,339 |
249,081 |
|
54,217 |
236,942 |
|
74,123 |
221,102 |
| Of which: loans and receivables |
84,841 |
207,968 |
|
49,146 |
191,368 |
|
69,543 |
173,810 |
| TOTAL |
98,379 |
286,307 |
|
59,465 |
268,892 |
|
82,437 |
253,215 |
(*) Mainly corresponds to assets provided in repurchase agreements and ECB financing transactions.
(**) Mainly corresponds to assets pledged for securitisation bonds, mortgage covered bonds and public sector covered bonds. These issuances are chiefly used in operations of issuances to market and as a guarantee in ECB funding operations.
The following table presents the assets received under guarantee, segregating those unencumbered from those that are pledged guaranteeing funding operations:
Assets securing financing operations and unencumbered assets (Millions of euros)
| |
|
31/12/2020 |
|
31/12/2019 |
|
31/12/2018 |
| |
|
FV OF COMMITTED ASSETS |
FV OF NON-COMMITTED ASSETS |
|
FV OF COMMITTED ASSETS |
FV OF NON-COMMITTED ASSETS |
|
FV OF COMMITTED ASSETS |
FV OF NON-COMMITTED ASSETS |
| Collateral received * |
2,631 |
13,573 |
|
1,790 |
15,841 |
|
2,097 |
13,323 |
| Equity instruments |
0 |
0 |
|
0 |
0 |
|
0 |
0 |
| Debt securities |
2,627 |
12,240 |
|
1,780 |
14,737 |
|
2,085 |
11,977 |
| Other guarantees received |
5 |
1,333 |
|
10 |
1,103 |
|
12 |
1,346 |
| Own debt securities other than covered bonds or own asset-backed securities ** |
0 |
249 |
|
0 |
12 |
|
0 |
251 |
| Own covered bonds and asset-backed securities issued and not pledged *** |
0 |
25,815 |
|
0 |
53,787 |
|
0 |
42,821 |
| TOTAL |
2,631 |
39,637 |
|
1,790 |
69,640 |
|
2,097 |
56,395 |
(*) Mainly corresponds to assets provided in reverse repurchase agreements, securities lending transactions and guarantees received through derivatives.
(**) Senior debt treasury shares.
(***) Corresponds to treasury shares issued in the form of securitisations and covered bonds (mortgage / public sector).
FV: Fair value
The asset encumbrance ratio is as follows:
Asset encumbrance ratio (Millions of euros)
| |
31/12/2020 |
31/12/2019 |
31/12/2018 |
| Encumbered assets and collateral received (numerator) |
101,010 |
61,255 |
84,534 |
|
Debt securities |
10,667 |
7,027 |
10,399 |
|
Loans and receivables |
84,846 |
49,156 |
69,555 |
|
Other assets |
5,498 |
5,071 |
4,580 |
| Total assets + Total assets received (denominator) |
400,891 |
345,988 |
351,071 |
|
Equity instruments |
1,849 |
3,063 |
4,144 |
|
Debt securities |
58,285 |
50,652 |
50,345 |
|
Loan portfolio |
292,814 |
240,524 |
243,364 |
|
Other assets |
47,944 |
51,748 |
53,218 |
| ASSET ENCUMBRANCE RATIO |
25.20% |
17.70% |
24.08% |
During 2020, the asset encumbrance ratio has increased by 7.50 percentage points with respect to the 2019 ratio, mainly due to higher policy encumbrance (use of TLTRO III).
Secured liabilities and the assets securing them are as follows:
Secured liabilities (Millions of euros)
| |
|
31/12/2020 |
|
31/12/2019 |
|
31/12/2018 |
|
|
LIABILITIES HEDGED, CONTINGENT LIABILITIES OR SECURITIES CEDED |
ASSETS, GUARANTEES RECEIVED AND TREASUREY INSTRUMENTS ISSUED * |
|
LIABILITIES HEDGED, CONTINGENT LIABILITIES OR SECURITIES CEDED |
ASSETS, GUARANTEES RECEIVED AND TREASUREY INSTRUMENTS ISSUED * |
|
LIABILITIES HEDGED, CONTINGENT LIABILITIES OR SECURITIES CEDED |
ASSETS, GUARANTEES RECEIVED AND TREASUREY INSTRUMENTS ISSUED * |
| Financial liabilities |
81,018 |
96,135 |
|
49,543 |
57,063 |
|
69,819 |
81,472 |
| Derivatives |
6,216 |
6,491 |
|
5,653 |
5,945 |
|
5,197 |
5,592 |
| Deposits |
58,621 |
70,457 |
|
26,281 |
30,322 |
|
45,517 |
51,321 |
| Issuances |
16,181 |
19,187 |
|
17,609 |
20,796 |
|
19,105 |
24,559 |
| Other sources of charges |
4,379 |
4,876 |
|
3,861 |
4,192 |
|
2,697 |
3,062 |
| TOTAL |
85,397 |
101,011 |
|
53,404 |
61,255 |
|
72,517 |
84,534 |
(*) Excluding encumbered covered bonds and asset-backed securities.
Residual maturity periods
The breakdown by contractual term to maturity of the balances of certain items on the balance sheets, without taking into account, where applicable, the value adjustments or value corrections, in a scenario of normal market conditions, is as follows
Residual maturity periods - 31-12-2020 (Millions of euros)
| |
|
DEMAND DEPOSITS |
3 MONTHS |
3-12 MONTHS |
1-5 YEARS |
> 5 YEARS |
TOTAL |
| Interbank assets |
96 |
53,492 |
2,328 |
2,514 |
5 |
58,435 |
| Loans and advances - Customers |
1,041 |
16,403 |
40,842 |
91,521 |
81,115 |
230,922 |
| Debt securities |
0 |
2,062 |
7,078 |
21,459 |
9,297 |
39,896 |
| FA under the insurance business - Debt securities |
|
598 |
544 |
947 |
724 |
2,813 |
| TOTAL ASSETS |
1,137 |
71,957 |
50,248 |
115,494 |
90,417 |
329,253 |
| Interbank assets |
1 |
5,575 |
2,520 |
51,999 |
316 |
60,411 |
| FL - Customer deposits |
17,606 |
36,810 |
55,305 |
60,397 |
72,489 |
242,607 |
| FL - Debt securities issued |
0 |
2,558 |
1,352 |
24,186 |
10,090 |
38,186 |
| Liabilities under the insurance business |
|
298 |
548 |
2,307 |
1,200 |
4,353 |
| TOTAL LIABILITIES |
17,607 |
44,943 |
59,177 |
136,582 |
82,895 |
341,204 |
|
Of which are wholesale issues net of treasury shares and multi-issuers |
0 |
2,541 |
100 |
16,329 |
16,040 |
35,010 |
|
Of which are other financial liabilities for operating lease |
0 |
0 |
14 |
120 |
1,334 |
1,468 |
| Drawable by third parties |
0 |
3,685 |
11,527 |
28,750 |
34,537 |
78,499 |
FA: Financial assets; FL: Financial liabilities
The transaction maturities are projected according to their contractual and residual maturity, irrespective of any assumption that the assets or liabilities will be renewed. In the case of demand accounts, with no defined contractual maturity, the Entity's internal behaviour models are applied. In order to assess the negative gap in the short term, the following aspects must be considered:
- The Group has high and stable retail financing with probable renewal.
- Additional guarantees are available at the European Central Bank, and there is the capacity to generate new deposits through asset securitisation and the issuance of mortgage- or public sector-covered bonds.
The calculation does not consider growth assumptions, and consequently disregards internal strategies for raising net liquidity, which are especially important in the retail market. The monetisation of available liquid assets is also not included.
As regards issuances, the Group’s policies take into account a balanced distribution of maturities, preventing concentrations and diversifying financing instruments. In addition, its reliance on wholesale markets is limited.
3.4.1 Credit risk
Overview
Credit risk corresponds to a decrease in the value of the Group’s assets due to uncertainty about a customer's or counterparty’s ability to meet its obligations to the Group. It is the Group's most significant risk financial activity, based on banking and insurance marketing, treasury operations and long-term equity instruments.
The maximum credit risk exposure of the financial instruments included under the financial instruments headings on the asset side of the balance sheet, including counterparty risk, are set out below:
Maximum exposure to credit risk (Millions of euros)
|
|
|
|
|
31/12/2020 |
|
31/12/2019 |
|
31/12/2018 |
|
|
|
|
|
MAXIMUM EXPOSURE TO CREDIT RISK |
HEDGING |
|
MAXIMUM EXPOSURE TO CREDIT RISK |
HEDGING |
|
MAXIMUM EXPOSURE TO CREDIT RISK |
HEDGING |
| Financial assets held for trading (Note 11) |
1,056 |
|
|
1,176 |
|
|
1,103 |
|
|
Equity instruments |
255 |
|
|
457 |
|
|
348 |
|
|
Debt securities |
801 |
|
|
719 |
|
|
755 |
|
| Financial assets not designated for trading compulsorily measured at fair value through profit or loss (Note 12) |
317 |
|
|
427 |
|
|
704 |
|
|
Equity instruments |
180 |
|
|
198 |
|
|
232 |
|
|
Debt securities |
52 |
|
|
63 |
|
|
145 |
|
|
Loans and advances |
85 |
|
|
166 |
|
|
327 |
|
| Financial assets at fair value with changes in other comprehensive income (Note 13) |
19,309 |
|
|
18,371 |
|
|
21,888 |
|
|
Equity instruments |
1,414 |
|
|
2,407 |
|
|
3,565 |
|
|
Debt securities |
17,895 |
|
|
15,964 |
|
|
18,323 |
|
| Financial assets at amortised cost (Note 14) |
273,129 |
(5,620) |
|
249,408 |
(4,706) |
|
248,299 |
(5,717) |
|
Debt securities |
24,681 |
(11) |
|
17,395 |
(6) |
|
17,064 |
(4) |
|
Loans and advances |
248,448 |
(5,609) |
|
232,013 |
(4,700) |
|
231,235 |
(5,713) |
|
|
Central banks |
4 |
|
|
6 |
|
|
5 |
|
|
|
Credit institutions |
5,847 |
|
|
5,155 |
(2) |
|
7,550 |
|
|
|
Customers |
242,597 |
(5,609) |
|
226,852 |
(4,698) |
|
223,680 |
|
| Trading derivatives and hedge accounting |
4,120 |
|
|
3,854 |
|
|
3,906 |
|
| Assets under the insurance business (Note 17) |
77,241 |
|
|
72,683 |
|
|
61,688 |
|
| TOTAL ACTIVE EXPOSURE |
375,172 |
(5,620) |
|
345,919 |
(4,706) |
|
337,588 |
(5,717) |
| TOTAL GUARANTEES GIVEN AND CONTINGENT COMMITMENTS (*) |
105,066 |
(193) |
|
98,340 |
(220) |
|
89,027 |
(355) |
| TOTAL |
480,238 |
(5,813) |
|
444,259 |
(4,926) |
|
426,615 |
(6,072) |
(*) CCF (Credit Conversion Factors) for guarantees given and credit commitments amount to EUR 75,560, 71,818 and 59,416 million respectively, at 31 December 2020, 2019 and 2018.
The maximum exposure to credit risk is the gross carrying amount, except in the case of derivatives, which is the exposure value according to the mark-to-market method, which is calculated as the sum of:
- Current exposure: the highest value between zero and the market value of an operation or of a portfolio of operations in a set of operations that can be offset with a counterparty that would be lost in the event of non-payment of the counterparty, assuming that none of the value of the operations will be recovered in the event of insolvency or settlement beyond the collateral received.
- Potential risk: variation of the credit exposure as a consequence of the future changes of the valuations of operations that can be offset with a counterparty during the residual term until maturity.
Regarding its ordinary business, the Group gears its lending activity towards meeting the finance needs of households and businesses and providing value-added services to the large corporates segment, within the medium–low risk profile set as a target in the RAF.
The core principles and policies that underpin credit risk management in the Group are as follows:
- Clear definition and allocation of responsibilities to the different areas participating in the cycle of granting, managing, monitoring and controlling credit risk.
- Agile and open dialogue with customers.
- Granting based on the borrower's repayment capability, with an adequate relationship between the income and expenses they assume.
- Uniformity regarding the analysis criteria and tools used for management and monitoring.
- Adequate assessment both of guarantees and of assets that are foreclosed or received in payment of debt.
- The existence of a monitoring framework that ensures that the information regarding the exposure to credit risk, the borrowers and the collateral is relevant and remains updated throughout the entire life cycle of the credit exposure.
- Accounting classification criteria of operations and for the quantitative assessment of expected losses and capital requirements for credit risk that accurately reflect the credit quality of the assets.
- Foresight, objectification, effectiveness and guidance for the customer in the process of recovering impaired assets.
Credit risk cycle
The full credit risk management cycle covers the entire life of the transaction, from feasibility studies and the approval of risks as per established criteria, to monitoring solvency and returns and, ultimately, to recovering non-performing assets. Diligent management of each of these stages is essential to successful recovery.
Approval and granting
The process for admitting and granting new loans is based on the analysis of the solvency of the parties involved and characteristics of the transaction.
The power system assigns an approval level to certain employees holding a position of responsibility established as standard associated with their position.
The authority system is based on the study of four key parameters:
Amount:
Financial amount applied for plus any risk already granted. The amount of the operation is defined through two alternative methods according to the sector to which the operations belong:
- Product-weighted loss: based on the expected-loss calculation formula, it takes into account the risk appetite according to the nature of each product. This system is used for applications where the principal borrower is a legal person.
- Nominal: it factors in the nominal amount and guarantees of risk operations. It applies to individuals.
Guarantee:
The group of assets and/or funds pledged to secure fulfilment of a repayment obligation.
General Risk Policies:
Raft of criteria identifying and assessing the relevant variables of each type of transaction, and which involve specific processing. These include, among others, NPL alerts, scoring/rating diagnosis, debt ratio, ratings resulting from monitoring activity or the fact that the operation is for a reduced amount.
Term:
The duration of the operations requested, which must be coherent with the purpose of the loan. There are specific policies according to the type of operation and its term, which require a higher level of authority for their approval.
In order to facilitate agility in granting, there are Risk Approval Centres according to the type of holder, individuals and self-employed workers in a centralised Individuals Approval Centre in Corporate Services, and legal entities in Approval Centres distributed throughout the country, which manage the applications within their power levels, and transfer them to specialised Corporate Service centres in the event the application exceeds their powers. Except those that can be approved at branch level or by the Business Area Manager, the risk of operations can only be approved when countersigned by a business manager and risk manager. Credit pre-granting is also conducted for legal entities and individuals in the micro-enterprise and small enterprise segments for certain products and in accordance with defined risk limits and criteria.
In particular, the internal organisation of Business Risk Approvals at Central Services is based on the following specialised structure, according to the type of risk and customer segment:
-
Corporate Risk:
centralises business groups with an annual turnover above EUR 200 million in the Corporate centre and in the International Branches.
-
Project Finance:
includes all operations presented through the project finance scheme and asset finance operations.
-
Business Risk:
legal entities or business groups with turnover up to EUR 200 million and those with turnover over EUR 200 million not managed by Corporate centres or the International Branches nor those that belong to specialised sectors (Property, Agro-food, Tourism or Project Finance).
-
Institutional Banking:
comprises public autonomous or central government institutions, town councils and local institutions, and members of economic groups or management groups whose representative/parent meets the aforementioned criteria. It also includes private institutions (foundations, universities, NGOs, religious orders, etc.) managed by the Institutions' Centres.
-
Real Estate Risk:
covers developers in any segment, regardless of turnover, and real estate investment companies.
-
Sovereign, Country and Financial Institution risk:
responsible for granting and managing country risk and financial institution risk inherent in funding transactions for the various segments.
-
Tourism and Agri-food Risk:
covers all companies and business groups that operate in the tourism and food and agriculture sectors. It also includes self-employed professionals in the farming sector.
Lastly, the Permanent Credit Committee holds the power to approve individual operations up to EUR 100 million, provided the accumulated risk with the customer is equal to or lower than EUR 150 million and, in general, it holds powers to approve operations that involve exceptions to the characteristics of those that can be approved in branches and in the RACs. In the event of exceeding the aforementioned amounts, the power of approval corresponds to the Executive Committee.
On the other hand, there are policies, methods and procedures for studying and granting loans, or responsible lending, as required in Act 2/2011 on Sustainable Economy and Order EHA/2899/2011 on transparency and protection of customers of banking services, or the more recent Property Credit Contract Regulatory Act 5/2019, of 15 March.
For pricing purposes, all the factors associated with the operation will be considered. In other words, costs involving structure, financing and expected loss of the operation. Furthermore, operations must provide a minimum contribution to economic capital requirements, which will be calculated net of tax.
Tools related to pricing and RAR (Risk-Adjusted Return) allow the highest standards to be reached in controlling the balance between risk and return, making it possible to identify the factors determining the returns of each customer more easily and, thus, to analyse customers and portfolios in accordance with their adjusted returns.
The Chief Business Officer is responsible for approving the prices of the operations. Following on from this, the determination of the prices is subject to a power system focused on obtaining minimum compensation and on establishing margins according to different businesses.
Mitigation of the risk
The Group's credit risk management profile is characterised by a prudent granting policy, at a price in keeping with the conditions of the borrower and suitable hedges/guarantees. In any case, long-term operations must have more robust guarantees due to the uncertainty deriving from the passing of time. These guarantees should never be used to substitute a lack of repayment capacity or an uncertain outcome for the operation.
For accounting purposes, effective guarantees or collateral are collateral and personal guarantees that can be demonstrated to be valid as risk mitigators, according to the time necessary for their execution and the capability of realising the guarantees, among other aspects. The different types of guarantees and collateral, along with the policies and procedures in their management and assessment, are as follows:
- Personal guarantees or those constituted due to the solvency of holders and guarantors: most of these relate to risk operations with companies in which the collateral provided by the shareholders, irrespective of whether they are individuals or legal entities, is considered relevant. For individuals, collateral is estimated on the basis of asset declarations. Where the backer is a legal entity, it is analysed as the borrower for the purposes of the approval process.
- Collateral: the main types of collateral accepted are:
- Pledged collateral: they notably include the pledge of operations of liabilities or the intermediated balances. To be admitted as collateral, financial instruments must, among other requirements: i) be free of liens and charges; ii) their contractual definition must not restrict their pledge; and iii) their credit quality or change in value must not be related to the borrower. The pledge remains in place until the loan matures, it is repaid early, or it is derecognised.
- Mortgage guarantees on properties. Internal policies for these establish the following:
- The procedure for approval of guarantees and the requirements for drawing up operations, e.g., the documentation that must be supplied by the holders and the mandatory legal certainty of this documentation.
- The review processes for the appraisals registered, in order to ensure proper monitoring and control of the guarantees. Regular processes are also carried out to check and confirm the appraisal values, in order to detect any anomalies in the procedures used by the valuation companies supplying the Group.
- The outlay policy, mainly concerning property development and self-development operations.
- The loan-to-value (LTV) of the operation. The capital to be granted in mortgage operations is limited to percentages of the value of the guarantee, which is defined as the lowest of the appraisal value and the value shown on the official deed or the accredited value of the property. IT systems calculate the level of approval required for each type of transaction.
- Credit derivatives: guarantors and counterparty. The Group occasionally uses credit derivatives, contracted with entities with a high credit level and protected by collateral contracts, to hedge against credit risk.
A breakdown of the guarantees received in the approval of the Group's lending transactions is provided below, specifying the maximum amount of the collateral that can be considered for the purposes of calculating impairment: the estimated fair value of property according to the latest appraisal available or an update on the basis of the provisions of applicable regulations in force. In addition, the remaining collateral is included as the current value of the collateral that has been pledged to date, not including personal guarantees:
Categorisation by stage of the credit investment and affected guarentees* (Millions of euros)
| |
31/12/2020 |
|
31/12/2019 |
|
31/12/2018 |
| |
GROSS AMOUNT |
ALLOWANCES FOR IMPAIRMENT |
VALUE OF COLLATERAL ** |
|
GROSS AMOUNT |
ALLOWANCES FOR IMPAIRMENT |
VALUE OF COLLATERAL ** |
|
GROSS AMOUNT |
ALLOWANCES FOR IMPAIRMENT |
VALUE OF COLLATERAL ** |
| Stage 1: |
212,834 |
(920) |
276,360 |
|
201,419 |
(574) |
288,563 |
|
194,618 |
(688) |
290,246 |
| Unsecured loans |
102,733 |
(606) |
0 |
|
85,640 |
(374) |
0 |
|
78,459 |
(320) |
0 |
| Real estate collateral |
103,520 |
(280) |
269,795 |
|
108,317 |
(116) |
281,058 |
|
110,276 |
(201) |
284,512 |
| Other collateral |
6,581 |
(34) |
6,565 |
|
7,462 |
(84) |
7,505 |
|
5,883 |
(167) |
5,734 |
| Stage 2: |
20,066 |
(1,064) |
25,846 |
|
15,541 |
(708) |
21,552 |
|
16,328 |
(741) |
24,636 |
| Unsecured loans |
8,299 |
(606) |
0 |
|
5,140 |
(379) |
0 |
|
4,883 |
(339) |
0 |
| Real estate collateral |
11,183 |
(411) |
25,004 |
|
9,833 |
(248) |
21,109 |
|
10,856 |
(302) |
24,099 |
| Other collateral |
584 |
(47) |
842 |
|
568 |
(81) |
443 |
|
589 |
(100) |
537 |
| Stage 3: |
8,256 |
(3,625) |
9,761 |
|
8,387 |
(3,416) |
9,929 |
|
10,733 |
(4,292) |
15,605 |
| Unsecured loans |
2,334 |
(1,869) |
0 |
|
2,251 |
(1,658) |
0 |
|
2,614 |
(1,550) |
0 |
| Real estate collateral |
5,787 |
(1,698) |
9,572 |
|
5,961 |
(1,656) |
9,831 |
|
7,897 |
(2,630) |
15,527 |
| Other collateral |
135 |
(58) |
189 |
|
175 |
(102) |
98 |
|
222 |
(112) |
78 |
| TOTAL |
241,156 |
(5,609) |
311,967 |
|
225,347 |
(4,698) |
320,044 |
|
221,679 |
(5,721) |
330,487 |
(*) Includes loans and advances to customers under the headings "Financial assets at amortised cost" (Note 14) and "Financial assets not designated for trading compulsorily measured at fair value through profit or loss" (Note 12)
(**) Reflects the maximum amount of the effective collateral that can be considered for the purposes of the impairment calculation, i.e. the estimated fair value of real estate properties based on their latest available valuation or an update of that valuation based on the applicable standard in force. In addition, the remaining collaterals are included as the current value of the collateral that has been pledged to date, not including personal guarantees.
On the other hand, counterparty risk mitigation measures are specified in section 3.4.1.
Monitoring and measurement of credit risk
The Group has a monitoring and measurement system that guarantees the coverage of any borrower or operation through methodological procedures adapted to the nature of each holder and risk:
1
Borrower monitoring processes
Scope
Individualised monitoring
Major risks:
By economic group of borrowers
- Greater than EUR 20 million, in general.
- Less than EUR 20 million but they meet the condition that some of its members of the group:
- It exceeds an exposure volume of EUR 10 million and shows some weakness (defaults greater tan 45 days, refinanced operations, etc.).
- Exceeds an exposure volume of EUR 5 million and has non-performing contracts.
Market and balance sheet risk:
Per borrower
- When there is market information.
Collective monitoring
Rest of operations/borrowers.
2
Quantification and assessment of the credit risk
Rating methodology
Manual
- Expert assignment of the follow-up rating for each borrower.
Automatic
- Model based on statistical patterns, (Early Alert Model, EAM), the PD calibrated with a forward-looking view and other relevant alerts.
3
Defining the accounting classification
Staging: assessment of the existence of SICR and default
Single names (SN)
- Borrowers that, due to their exposure volume or associated risk, require customised and expert treatment.
- File on SN and ongoing and proactive management via triggers.
Rest (NON-SN)
- Classification through automatic processes.
- There is alignment between the monitoring rating and accounting classification.
4
Defining the hedge accounting
Based on the expected loss
- Monitoring.
- Hedging determined through statical models based on the Group's experience and forecasts of relevant variables.
1
Borrower monitoring processes
The aim is to determine the quality of the risk assumed with the borrower ("Monitoring Rating") and actions that need to be taken according to the result, including the estimation of impairment. The targets of risk monitoring are the borrowers that hold the debt instruments and off-balance sheet exposures that bear credit risk, and the profit or loss is a reference for the future granting policy.
The Credit Risk Monitoring Policy is prepared based on the type and specific nature of the exposure, segregated into differentiated areas, in accordance with the various credit risk measurement methods.
The Monitoring Rating is an assessment of each customer’s situation and risks. All borrowers have a monitoring rating which classifies them into one of five categories2 : insignificant risk, low risk, moderate risk, high risk or doubtful; and they can be generated manually (in the case of the scope of borrowers under individualised monitoring) or automatically (for the rest).
According to the scope of monitoring and rating relating to the borrowers, monitoring can be:
-
Individualised: applied to exposures of a significant amount or that have specific characteristics. The monitoring of major risks leads to the issuance of group monitoring reports, concluding in a monitoring rating for the borrowers in the group. .
The Group defines individually significant borrowers (Single Names) as those that meet the following thresholds or characteristics3 :
- Exposure of greater than EUR 20 million for two consecutive months or greater than EUR 24 million for one month.
- Exposure of greater than EUR 10 million for two consecutive months or greater than EUR 12 million for one month, which meet at least one of the following criteria: expected loss of greater than EUR 200 thousand, with refinanced operations, with early non-performing loans (>45 days) or those that form part of the Entity's consolidated group through the equity consolidation method.
- Exposure of greater than EUR 5 million with doubtful operations (objective or subjective) representing more than 5% of the total risk of the borrower.
- Borrowers that form part of the Group (due to global integration), with the exception of BPI.
- Collective: The ratings are obtained by combining a statistical model, referred to as the Early Alert Model (EAM), the Probability of Default (PD) calibrated with a forward-looking view (consistent with the PD used to calculate the credit risk hedges) and other relevant alerts. Both the EAM and the PD are obtained at least on a monthly basis, and daily in the case of the alerts.
Additionally, the EAM and PD models are subject to the Group's Credit Risk Model Framework.
(2) The monitoring rating is an assessment of each customer’s situation and risks. The different monitoring ratings are as follows:
• Insignificant risk: all customer operations are performing correctly and there are no indications that call the repayment capacity into question.
• Low risk: the payment capacity is adequate, although the customer or one or more of their operations shows some minor indication of weakness.
• Medium risk: there are indications of customer impairment, nonetheless, these weaknesses do not currently put at risk the debt repayment capacity.
• Medium-high risk: the customer's credit quality has been seriously weakened. If the customer impairment continues, the customer may not have the capacity to repay the debt.
• Doubtful: there is evidence of sustained impairment or non-performance as regards the customer capacity to meet their obligations.
• No rating: there is insufficient information to assign a monitoring rating.
(3) In addition to these borrowers, an individual assessment of the credit loss will be required for operations with a low credit risk, qualified as such as a result of having no appreciable risk, that are nevertheless in a doubtful situation. Applying materiality criteria, the individual estimate of expected losses will be performed whenever a borrower represents an exposure of more than EUR 1 million and more than 20% is considered doubtful.
2
Quantifying and assessing credit risk
Credit risk quantifies losses that might derive from failure by borrowers to comply with their financial obligations, based on two concepts: expected loss and unexpected loss.
Expected Loss (EL):
This is the average or mathematical expectation of potential anticipated losses calculated by multiplying the three following factors: probability of default (PD), exposure at default (EAD) and loss given default (LGD).
Unexpected loss:
potential unforeseen loss caused by variability in losses with respect to the estimated expected loss. It can occur due to sudden changes in cycles or alterations in risk factors, and the dependence between the credit risk for the various debtors. Unexpected losses have a low probability and large amount, and should be absorbed by own funds. The calculation of unexpected loss is also mainly based on the operation's PD, EAD and LGD.
Credit risk parameters are estimated based on the historical default experience. To do so, the Bank has a set of tools and techniques for the specific needs of each type of risk, described below according to how they affect the three factors for calculating the expected loss:
EAD:
an estimate of the outstanding debt in the event of default by the customer. This measurement is significant for financial instruments with a repayment structure that varies according to customer drawdowns (in general, any revolving credit product).
The estimate is based on observing internal default experience, relating the drawdown levels upon default to drawdown levels over the 12 preceding months. To build the model, several variables are considered, such as product type, term to maturity and customer characteristics..
PD:
the Group uses management tools covering virtually all of its lending business to help predict the probability of default associated with each borrower.
These tools, implemented in the branch network and the risk monitoring and granting channels, were developed on the basis of NPL experience and include the measurements required to fine-tune the results both to the business cycle, with a view to securing relatively stable measures in the long term and to recent experience and future projections. The models can be classified according to their orientation toward the product or customer:
- Product-oriented tools are used mainly within the scope of authorisation of new retail banking operations (approval scorings) and take account of the debtor’s characteristics, information deriving from the customer relationship, internal and external alerts, as well as the specific characteristics of the operation to determine its probability of default.
- Customer-oriented tools assess the debtor’s probability of default. They comprise behavioural 'scoring' models for monitoring the risk of individuals and ratings or companies.
Rating tools for companies are specific according to the customer segment. The rating process for micro-enterprises and SMEs, in particular, is based on a modular algorithm, which rates three different sets of data: the financial statements, the information drawn from dealings with customers, internal and external alerts and certain qualitative factors.
As regards large corporates, the Group has models that require the expert judgement of analysts and seek to replicate and be coherent with the ratings of rating agencies. In view of the lack of sufficient frequency of internal default rates for drawing up purely statistical models, the models in this segment were built in line with the Standard & Poor’s methodology, enabling the public global default rates to be used, making the methodology much more reliable.
The customers are scored and rated on a monthly basis in order to keep the credit rating up-to-date, except for the rating of large corporates, which is updated at least annually or if significant events arise that can alter credit quality. For legal entities, the financial statements and qualitative information is updated periodically to achieve the maximum level of coverage of the internal rating.
LGD:
quantifies the unrecoverable debt in the event of customer default.
The historic loss given default is calculated using internal information, taking into account the cash flows associated with contracts from the moment of default. The models allow different loss given defaults to be obtained based on the guarantee, the loan to value ratio (LTV), the product type, the borrower's credit quality and, for uses in which it is required by regulation, the recessional conditions of the economic cycle. An estimate is also made of the indirect expenses (office staff, infrastructure costs and similar) associated with the recovery process. In the case of large corporates, loss given default also includes elements of expert judgement, coherent with the rating model.
It is worth noting that the Group considers, through severity, the income generated in the sale of defaulted contracts as one of the possible future flows generated to measure the expected impairment losses of the value of loans and advances. This income is calculated on the basis of the internal information of the sales carried out in the Group4. The sale of these assets is considered to be reasonably predictable as a method of recovery, thus, as part of its strategy for reducing doubtful balances, the Group considers portfolio sales as one of the recurring tools. In this regard, an active market for impaired debt exists, which ensures with a high probability the possibility to make future sales of debt (see Note 27.4, detailing the sales of the non-performing and defaulted loan portfolio).
In addition to regulatory use to determine the Group's minimum capital requirements and the calculation of hedges, the credit risk parameters (PD, LGD and EAD) are used in a number of management tools, such as in the risk-adjusted return calculation tool, the pricing tool, the customer pre-qualification tool, monitoring tools and alert systems.
(4) See Note 2.7, in reference to cases of sales with a significant increase in credit risk not compromising the business model of maintaining assets to receive contractual cash flows
3
Defining the accounting classification
The accounting classification of operations with credit risk among the different Stages of IFRS 9 is defined in the event of a default and/or significant increase in credit risk (SICR) since the operation's initial recognition.
It will be considered that there has been an SICR from the first recognition, whereby these operations are classified as Stage 2, when there are weaknesses that may involve assuming significantly higher losses than expected at the time the loan is granted. To identify it, the Group has the monitoring and rating processes described in 2| Quantifying and assessing credit risk. Specifically, when the operations meet any of the following qualitative or quantitative criteria, unless they must be classified as Stage 3:
- 1) Refinanced exposures that do not classify as Stage 3. stage 3.
- 2) Operations involving borrowers that are in administration which do not classify as Stage 3, because:
- The borrower has paid at least 25% of the company's loans affected by the administration situation – after discounting the agreed write-off, where applicable.
- Two years have passed since the deed of approval of the creditors' agreement was registered in the Companies Register, provided that this agreement is being faithfully complied with and the company's equity and financial situation eliminates any doubts over the amounts owed being fully reimbursed, unless interest charges that are clearly below market rates have been agreed.
- 3) Operations with amounts that are more than 30 days overdue (but less than 90, in which case they would be classified as Stage 3).
- 4) Operations which can be identified as having registered a significant increase in credit risk on the basis of market indicators/triggers.
- 5) Operations for which there has been an SICR since the date of initial recognition on the basis of any of the following two criteria (the fulfilment of one of these two criteria is sufficient for classification as Stage 2), unless, for exposures with individually significant or Single Name borrowers, the individual analysis determines that there has not been any significant increase in risk: a deterioration in its monitoring rating or a relative increase in PD (see in further detail below).
There have not been any changes since the prior year in the criteria for identifying a significant increase in credit risk. Without prejudice to the above, in the context of COVID-19, the Company has applied certain prudent adjustments that are covered in the “COVID-19 impact” section.
Unless they are identified as refinancing, refinanced or restructured operations, those that no longer meet the conditions to qualify for Stage 2 will be classified as Stage 1.
With respect to refinancing, refinanced or restructured operations that classify as Stage 2 due to failing to proceed to classify them as Stage 3 on the date of refinancing or restructuring or due to having been reclassified from the Stage 3 category, they will remain identified as Stage 2 for a probationary period until they meet all the following requirements: i) it is concluded that they are unlikely to have financial difficulties and therefore it is highly probable that they will meet their obligations vis-á-vis the entity in both time and form; ii) a minimum period of two years has elapsed from the date of authorisation of the restructuring or refinancing operation, or, if later, from the date of its reclassification from Stage 3; iii) one of the holders does not hold any other operations with amounts more than 30 days overdue at the end of the probationary period, and iv) the borrower has covered all the principal and interest payments from the date of authorisation of the restructuring or refinancing operation, or, if later, from the date of its reclassification from Stage 3.
Furthermore, the borrower must have made regular payments of an amount equivalent to the whole amount (principal and interest) falling due at the date of the restructuring or refinancing operation, or that were derecognised as a result of it, or when it is deemed more appropriate, given the nature of the operations, that the borrower complies with other objective criteria that demonstrate their payment capacity. This implies that there are no contractual clauses that may delay repayments, such as grace periods for the principal.
It will be considered that there has been a default and, therefore, an operation will be classified at Stage 3 when – regardless of the borrower and the guarantee – there is an amount overdue (capital, interests or contractually agreed costs) by more than 90 days, as well as the operations of all other holders when operations with past due amounts of over 90 days account for more than 20% of the amounts pending collection.
Operations classified as Stage 3 due to the customer being non-performing will be reclassified to Stage 1 or Stage 2 when, as a result of charging part of the overdue amounts, the reasons that caused their classification as Stage 3 disappear and there remain no reasonable doubts regarding their full repayment by the holder for other reasons.
In addition, the following operations will be classified as Stage 3: i) operations with legally demanded balances; ii) operations in which the collateral execution process has been initiated; iii) operations made by insolvent borrowers that should not be classified as write-offs; iv) refinancing, refinanced or restructured operations classifiable as non-performing including those that, having been classified as non-performing before the trial period, are refinanced or restructured or that have amounts that are more than 30 days past-due, and v) operations of holders who, after an individualised study, pose reasonable doubts regarding full repayment (principal and interest) on the contractually negotiated terms.
Unless they are identified as refinancing, refinanced or restructured operations, those classified as Stage 3 for reasons other than the customer being non-performing can be reclassified to Stage 1 or Stage 2 if, as a result of an individualised study, the reasonable doubts regarding their full repayment by the holder on the contractually agreed terms disappear and there are no amounts overdue by more than ninety days on the date of reclassification to Stage 1 or Stage 2.
In the case of refinanced, restructured or refinancing operations, in order to consider the credit quality of the operation to have improved and, therefore, to proceed to reclassify it to Stage 2, all the following criteria must be verified in general: i) a period of one year has elapsed from the refinancing or restructuring date; ii) the borrower has covered all the principal and interest payments (i.e. the operation has no overdue amounts) thereby reducing the renegotiated principal, from the date of authorisation of the restructuring or refinancing operation, or, if later, from the date of its reclassification to the non-performing category; iii) furthermore, regular payments must have been made of an amount equivalent to the whole amount (principal and interest) falling due at the date of the restructuring or refinancing operation, or that were derecognised as a result of it, or when it is deemed more appropriate, given the nature of the operations, the borrower complies with other objective criteria that demonstrate their payment capacity, and iv) one of the holders does not have any other operations with amounts overdue by more than 90 days.
The exposures of borrowers declared subject to bankruptcy proceedings without an application for liquidation will be reclassified to Stage 2 if the borrower has paid at least 25% of the credit from the entity that is affected by the bankruptcy proceedings (once the agreed debt reduction, where applicable, has been deducted), or if two years have elapsed since the order approving the creditors’ agreement was registered with the Commercial Register, provided that this agreement is being faithfully performed and the equity and financial situation of the corporation dispels any doubts regarding full repayment of its debts, all unless interest has been agreed that is noticeably lower than the market rate.
The process for determining the borrower's accounting classification is specified below:
Single Name:
These borrowers are constantly assessed as regards the existence or indications of impairment, as well as a potential significant increase in credit risk (SICR) from the initial recognition, and losses associated with the assets of this portfolio are assessed.
In order to help with the proactive management of evidence and indications of impairment and a significant increase in risk, triggers have been developed – for borrowers and for operations – that are grouped according to the sector to which they belong, since the latter conditions the type of information required to analyse the credit risk and the sensitivity to the changes of variables indicative of the impairment. The abovementioned triggers are based on available internal and external information that may affect the borrower, as well as automatic alerts that can alert of a significant risk event. The triggers gather, among other aspects, changes in the price of financial assets, and actual or expected significant changes in the external and internal credit rating of the financial instruments in question. These triggers are assessed by the analyst to determine the classification of the customer's operations in Stage 2 or Stage 3:
Global triggers:
- Financial difficulties of the issuer or debtor: subjective doubtful triggers (i.e. unfavourable financial information on the debtor, measured via various ratios on their financial statements) and triggers of a minimum of Stage 2 (due to deterioration of the monitoring rating).
- A breach of contract, such as a default or delinquency in interest or principal payments: Stage 3 triggers (i.e. non-payments exceeding 90 days) and triggers of a minimum of Stage 2 (non-payments exceeding 30 days).
- Probability of the borrower declaring bankruptcy or restructuring. Stage 3 trigger (declaration of insolvency).
- Market triggers. There are triggers referring to identifying financial difficulties of the debtor or issuer, referring to breaches of contractual clauses or to the disappearance of an active market for the financial security:
- External or internal rating that indicates either default or near to default (Level 6 rating as defined in the CRR).
- Significant downgrading of the borrower's credit rating by the Entity
- Automatic rating downgrading
- External Rating below CCC+
- Relative change in the CDS compared to a reference index (iTraxx)
- Significant downgrading in the external rating of the issuer with respect to when the operation was initially granted
- Non-payment event other than those mentioned in the ISDA definition of default
- Decrease in the price of the borrower's bond issues of > 30% or quoted price below 70%
- Suspension of the listing of the borrower's shares
Specific triggers:
For sectors such as property developers, project finance and public administrations.
In cases in which, in the opinion of the analyst, contracts are classified as Stage 2 or Stage 3, the expert calculation of the specific provision is used.
Other contracts (not Single Name):
As previously stated, when the borrower's monitoring rating has significantly deteriorated or when there is a relative increase of relevant PD with respect to the start of the operation, the Entity proceeds to classify the contract at accounting Stage 2. For these purposes, the classification is revised monthly, taking into account that the fulfilment of any of the two conditions below will determine that a SIRC exists:
- A deterioration of the monitoring rating: it will be considered that there has been an SICR if, on the date of classification for accounting purposes (each month-end close), the borrower has exacerbated their monitoring rating, to a moderate risk or worse, since the operation's initial recognition.
- A relative increase in PD: it will be considered that there has been an SICR if the regulatory PD of the operation on the accounting classification date exceeds a certain absolute threshold and there has been a relative increase in the regulatory PD5 (also exceeding a certain threshold) of the operation in question since its initial recognition (in the case of exposures with individuals, a comparison is made with the first and oldest live risk PD of the operation). It must therefore be classified as Stage 2, if the following conditions are met:
- Master scale6 greater than or equal to 4. Contract with a Master Scale of 4, i.e. PD greater than 0.4205%.
- The contract's current PD is more than 3.75 times its original PD.
- The difference between the current Master Scale and the original Master Scale is equal to or greater than two degrees.
The most recent monitoring rating and PD classification
Which are updated at least monthly. All other classification criteria in Stage 2 or Stage 3 are also revised monthly.
(5) Regulatory PD: probability of default estimated as the average PD expected through-the-cycle, in accordance with the CRR requirements for its use for the effect of calculating risk-weighted assets under the internal-ratings-based (IRB) approach.
(6) The Master Scale is a table of correlation between probability of default (PD) ranges and a scale between 0 and 9.5, 0 being the score associated with the best PDs and 9.5 being the score associated with the highest PDs of the performing portfolio. The use of this Master Scale is linked to the use in management of probabilities of default, since elements such as cut-off points or levels of power are expressed in terms of Master Scale score instead of PD.
4
Defining the accounting hedge
The aim of the IFRS 9 requirements as regards impairment is to ensure recognition of the expected credit losses of operations, assessed collectively or individually, considering all the reasonable and substantiated information available, including forward-looking information.
Principles for measuring expected credit losses for the purpose of defining the credit risk loss hedges
The calculated accounting hedging or provision is defined as the difference between the gross carrying amount of the operation and the estimated value of future expected cash flows, discounted at the original effective interest rate of the operation, considering the effective guarantees received.
The Group estimates the expected credit losses of an operation so that these losses reflect:
a
A weighted and non-biased amount, determined through the assessment of a series of possible results;b
The time value of the money, andc
The reasonable and substantial information that is available at the reference date, at no disproportionate cost or effort, on past events, current conditions and forecasts of future economic conditions.
In line with applicable rules, the hedging calculation method is set according to whether the borrower is individually significant and its accounting category 7 .
- If, in addition to being individually significant, the customer has operations that are non-performing (whether for reasons of delinquency or for other reasons) or in Stage 28, , the allowances for the non-performing operations will be estimated through a detailed analysis of the status the borrower and their capacity to generate future flows.
-
In all other cases, hedging is estimated collectively using internal methodologies, subject to the Credit Risk Model Framework in force, based on past experience of portfolio defaults and recoveries, and factoring in the updated and adjusted value of the effective guarantees. Additionally, future economic condition predictions will be considered under various scenarios.
To determine hedging for credit losses of portfolios under collective analysis, models are used to estimate the PD; probability of correcting defaulting cycles (specifically its complementary measurement, PNC); loss given loss (LGL) in the event of no correction; recoverable value models for mortgage guarantees (haircuts); as well as adjustments to include lifetime or forward-looking effects, according to the agreement's accounting classification. We must emphasise that the set of models of haircuts, LGL and PNC are models of LGD or severity.
The models used are re-estimated or re-trained every six months, and they are executed monthly in order to properly reflect the current economic environment at any given time. This makes it possible to reduce the differences between estimated loss and recent observations. The models will include an unbiased view of the potential forward-looking evolution to determine the expected loss, taking into account further relevant macroeconomic factors: i) GDP growth; ii) the unemployment rate; iii) 12-month Euribor; and iv) changes in property prices. Following on from this, the Group generates a baseline scenario, as well as a range of potential scenarios that make it possible to perform a weighted adjustment of the estimated expected loss, based on its probability. Without prejudice to the above, in the context of COVID-19, the Company has applied a prudential approach to constitute a generic provision fund that is covered in the “COVID-19 impact” section.
The existence of the collateral, particularly for the individual analysis, is not used to assess the credit quality of borrowers, however, for activities that are closely related to the collateral, such as Real Estate Developments, the reduced value of said collateral is analysed to assess the increase or reduction of the borrower's risk level.
As indicated in 3 the collective analysis, the automatic rating is generated using a combination of i) a risk-model rating and ii) an alert-based rating. Considering that the Entity's policy in relation to granting asset operations follows the customer's repayment capacity as a criterion, and not recovery via the allocation of guarantees, the collective analysis is focused on assessing the credit quality of borrowers and not the assessment of collateral provided. In this regard, the main guarantees (or collateral) of the Group are mortgage-related, with no significant value fluctuations that could be considered evidence of a significant risk of credit risk in mortgages.
(8) As indicated in 3 the Single Names portfolio analysis is carried out individually in its totality, determining the stage in an expert manner for each of the instruments analysed, on the basis of the knowledge of the borrowers and experience. When required, the coverage calculation also uses this individualised approach.The credit loss of the instruments of the portfolio that are monitored individually, and which are classified individually in stage 1, is calculated collectively on the basis of the knowledge of the borrowers and experience. This way of estimating expected losses would not have led to material differences in their totality, compared with an estimate using individual estimates. This is due to the fact that, in general, the information to be considered in performing the collective calculation would have been equivalent to that used for individual estimates.
.
The calculation process is structured in two steps:
Setting the basis for the calculation of allowances, in two steps:
Calculation of the exposure amount, which is the sum of the gross carrying amount at the time of calculation and off-balance sheet amounts (available or exposure) expected to be disbursed when the borrower fulfils the conditions to be considered non-performing..
Calculation of the recoverable value of the effective guarantees linked to the exposure. In order to establish the recoverable value of these guarantees, for real estate collateral the models estimate the amount of the future sale of the collateral, which is discounted from the total expenses incurred until the moment of the sale.
Establishing the hedging to be applied on the basis for the calculation of allowances:
This calculation factors in the probability of the borrower defaulting on the operation obligations, the probability of the situation being remedied or resolved and the losses that would occur if this did not happen.
For insignificant portfolios where it is considered that the internal model approach is not suitable due to the processes involved or a lack of past experience, the default coverage rates established in the current national regulations may be used.
Transactions classified as not bearing appreciable risk and those that, due to their type of collateral, are classified as not bearing appreciable risk, could have 0% accounting hedging. In the case of the latter, this percentage will only be applied to the guaranteed part of the risk.
The hedges estimated individually or collectively must be consistent with the way in which the categories into which the operations can be classified are processed. In other words, the hedging level for an operation must be higher than the hedging level that would correspond to it, if it were classified in another category of a lower credit risk.
The necessary improvements detected in the backtesting and benchmarking exercises are also incorporated into the review cycles. Similarly, the models developed are documented so they can be replicated by a third party. The documentation contains key definitions, information regarding the process of acquiring samples and data processing, methodological principles and results obtained, as well as the comparison of said results with those of previous years.
CaixaBank has a total of 81 models, in order to obtain the parameters necessary to calculate the hedges using a collective analysis. For each of the risk parameters, different models can be used to adapt to each type of exposure. Specifically, the models include those indicated below:
18
Scoring and Rating parameter models
3
Haircut parameter models
1
LT/FL (Life-time/Forward-looking) transformation parameter model
Other subsidiaries also have additional internal models. Banco BPI has a total of 70 and CaixaBank Payments & Consumer has a total of 51.
The amount of the operations of holders that have not been classified as Stage 3 despite there being amounts more than 90 days overdue with the same debtor
Operations by holders that have not been classified as Stage 3 despite there being amounts overdue by more than 90 days with the same debtor are not of a significant amount..
Inclusion of forward-looking information into the expected loss models
The projected variables considered are as follows:
Forward-looking macroeconomic indicators - 31-12-2020(*) (% percentages)
|
|
|
SPAIN |
|
PORTUGAL |
|
|
|
2021 |
2022 |
2023 |
|
2021 |
2022 |
2023 |
| GDP growth |
|
|
|
|
|
|
|
|
Baseline scenario |
6.0 |
4.4 |
2.0 |
|
4.9 |
3.1 |
1.8 |
|
Upside range |
7.7 |
5.0 |
1.9 |
|
6.9 |
3.5 |
2.0 |
|
Downside range |
1.7 |
5.5 |
2.8 |
|
(0.3) |
4.2 |
3.3 |
| Unemployment rate (**) |
|
|
|
|
|
|
|
|
Baseline scenario |
17.9 |
16.5 |
15.4 |
|
9.1 |
7.7 |
6.9 |
|
Upside range |
16.9 |
14.9 |
14.1 |
|
8.3 |
7.0 |
6.3 |
|
Downside range |
20.8 |
18.4 |
16.7 |
|
10.1 |
8.3 |
7.3 |
| Interest rates |
|
|
|
|
|
|
|
|
Baseline scenario |
(0.47) |
(0.40) |
(0.21) |
|
(0.47) |
(0.40) |
(0.21) |
|
Upside range |
(0.44) |
(0.32) |
(0.08) |
|
(0.44) |
(0.32) |
(0.08) |
|
Downside range |
(0.55) |
(0.50) |
(0.42) |
|
(0.55) |
(0.50) |
(0.42) |
| Evolution of property prices |
|
|
|
|
|
|
|
|
Baseline scenario |
(2.0) |
0.8 |
1.8 |
|
(6.1) |
(1.0) |
1.6 |
|
Upside range |
0.0 |
2.6 |
2.2 |
|
(3.3) |
0.8 |
2.1 |
|
Downside range |
(5.2) |
(1.3) |
1.3 |
|
(9.0) |
(3.2) |
1.5 |
(*) Source: CaixaBank Research
(**) For models for default frequency projection in Spain, the unemployment rates shown in this table have increased, including 10% of the workers included in Temporary Redundancy Plans
Forward-looking macroeconomic indicators - 31-12-2019 (*) (% percentages)
|
|
|
SPAIN |
|
PORTUGAL |
|
|
|
2020 |
2021 |
2022 |
|
2020 |
2021 |
2022 |
| GDP growth |
|
|
|
|
|
|
|
|
Baseline scenario |
1.5 |
1.5 |
1.4 |
|
1.7 |
1.6 |
1.4 |
|
Upside range |
2.3 |
2.6 |
1.9 |
|
2.8 |
2.4 |
1.9 |
|
Downside range |
0.6 |
0.3 |
0.9 |
|
0.1 |
0.2 |
0.3 |
| Unemployment rate |
|
|
|
|
|
|
|
|
Baseline scenario |
12.6 |
11.5 |
10.3 |
|
6.1 |
6.0 |
5.8 |
|
Upside range |
12.1 |
10.0 |
8.4 |
|
5.4 |
4.6 |
4.5 |
|
Downside range |
13.6 |
13.7 |
12.9 |
|
7.9 |
8.3 |
8.3 |
| Interest rates (**) |
|
|
|
|
|
|
|
|
Baseline scenario |
(0.3) |
(0.1) |
0.3 |
|
(0.3) |
(0.1) |
0.4 |
|
Upside range |
(0.3) |
0.1 |
0.5 |
|
(0.2) |
0.2 |
0.7 |
|
Downside range |
(0.4) |
(0.4) |
(0.3) |
|
(0.3) |
(0.3) |
(0.1) |
| Evolution of property prices |
|
|
|
|
|
|
|
|
Baseline scenario |
3.2 |
3.0 |
2.9 |
|
6.1 |
3.8 |
2.7 |
|
Upside range |
4.7 |
5.8 |
4.9 |
|
8.5 |
6.1 |
3.2 |
|
Downside range |
1.2 |
(0.4) |
0.9 |
|
1.3 |
0.3 |
1.3 |
(*) Source: CaixaBank Research
(**) The 12-month Euribor is used in the case of Spain (average for the period) and the 6-month Euribor for Portugal (end of the period).
The weighting of the scenarios considered in each of the financial years for each sector is as follows:
Weighting of occurence of the considered scenarios (% percentatges)
|
|
|
31/12/2020 |
|
31/12/2019 |
| |
BASELINE SCENARIO |
UPSIDE SCENARIO |
DOWNSIDE SCENARIO |
|
BASELINE SCENARIO |
UPSIDE SCENARIO |
DOWNSIDE SCENARIO |
| Spain |
60 |
20 |
20 |
|
40 |
30 |
30 |
| Portugal |
60 |
20 |
20 |
|
40 |
30 |
30 |
The modification to the macroeconomic scenario and the application of a prudent approach as a consequence of the impacts of COVID-19 has entailed constituting hedging within the Group of EUR 1,252 million at 31 December 2020. The combination of scenarios gives us better projection in the context of the current uncertainty, although said provisions will be reviewed periodically in the future as new information becomes available.
In accordance with the principles of the applicable accounting standard, the hedging level factors in a forward-looking (12-month) or life-time vision, according to the accounting classification of the exposure (12 months for Stage 1 and life-time for Stages 2 and 3).
The relationship between the various variables that measure or quantify the economic situation, such as gross domestic product growth and the unemployment rate, is well known. These interrelationships make it difficult to establish clear causality relationships between a specific variable and an effect (e.g. expected credit losses), as well as making it difficult to interpret the sensitivities to calculations performed using expected credit loss models when these sensitivities are applied to various variables simultaneously.
Interest rates, which also form part of the group of forward-looking indicators, have only a minor impact on the calculation of expected credit losses and apply only to the portfolio of consumer loans, among the significant portfolios.
The table below shows the estimated sensitivity to a loss of 1% of gross domestic product, as well as a 10% drop in real estate prices in the expected losses due to credit risk at 2020 year-end, broken down by portfolio type for business in Spain:
Analysis - Spain (Millions of euros)
| |
INCREASE IN EXPECTED LOSS |
| |
1% DROP IN GDP |
10% DROP IN REAL ESTATE PRICES |
| Credit institutions |
0 |
0 |
| Public administrations |
0 |
0 |
| Other financial institutions |
1 |
0 |
| Non-financial corporations and individual entrepreneurs |
40 |
176 |
| Project finance |
10 |
47 |
| For financing real estate construction and development, including land |
5 |
36 |
| For financing civil engineering work |
3 |
10 |
| Rest of specialised lending |
2 |
1 |
| Purposes other than project finance |
30 |
129 |
| Large corporates |
11 |
13 |
| SMEs |
15 |
96 |
| Individual entrepreneurs |
4 |
20 |
| Households (excluding individual entrepreneurs) |
69 |
343 |
| Home purchases |
50 |
253 |
| For the purchase of a main residence |
49 |
248 |
| For the purchase of a second residence |
1 |
5 |
| Consumer credit |
9 |
23 |
| Consumer credit |
9 |
23 |
| Credit card debt |
0 |
0 |
| Other purposes |
10 |
67 |
| TOTAL |
110 |
519 |
The table below shows the estimated sensitivity to a loss or gain of 1% of gross domestic product for business in Portugal:
Sensitivity analysis - Portugal (Millions of euros)
| |
INCREASE IN EXPECTED LOSS * |
| |
1% GDP GROWTH |
1% FALL IN GDP |
| TOTAL |
(13) |
13 |
(*) GDP-focused sensitivity calculation which, by its nature, enables the effect of rest of the macroeconomic indicators to be gathered jointly, given their high level of interdependence.
The models and the estimates on macro-economic variations are periodically reviewed to detect possible impairment in the quality of the measurements. This continual risk assessment provides information on the distribution of risk exposure in the various portfolios with respect to creditworthiness, expressed as a probability of default.
NPL management
The recovery and NPL management function is aligned with the Group's risk management guidelines. The activity to monitor non-payment and recovery becomes especially relevant in the current unfavourable economic context as a result of the pandemic due to COVID-19, with the main goal being to minimise the impact on the volume of non-performing positions.
On one hand, the governance model and the operational framework of problematic asset management has been advanced, maintaining the comprehensive approach to the overall life cycle and strengthening the specialised management according to the moment of non-payment of the debt. Responsibility for the management is broken down into two different fields:
- Flow management: comprises early NPL management of customers with between 1 and 90 days of non-payment. From the business field, the Solutions & Collections area centrally coordinates the branch network and recovery agencies in managing the recovery prior to entering accounting arrears. In the current economic outlook, the capillarity of the branch network and its proximity to customers continues to be key to identifying the situation and needs of customers, especially situations of social vulnerability.
- Stock management: concentrates the management of customers who are in accounting arrears, with non-payments in excess of 90 days. This is the responsibility of the Risk Area, with management differentiated into the individual customer and business customer segments. The team specialists is geared towards seeking concluding solutions in more advanced situations of non-payment.
On the other hand, the overall management of recovery and NPLs has been adapted to the measures adopted by CaixaBank to support the economy in order to combat the pandemic. In terms of non-performing assets, it has collaborated in identifying and providing support with sustainable solutions for customers whose debt is still structurally viable, ensuring that the financing needs of customers arising from a temporary reduction of their income are covered. All this management has been subject to the application of the policies and procedures in force in the Company which, in accordance with accounting and regulatory standards, lay down the guidelines for the suitable classification of borrowings and estimation of hedges.
A noteworthy key line of work is the accompaniment throughout the management cycle of the moratoria and ICO-backed loans granted by the Company, especially through active monitoring of the maturity of the measures granted.
Foreclosed assets
BuildingCenter is the Group's company responsible for the ownership of property assets in Spain, which basically originate from streamlining of the Group's credit activity through any of the following ways: i) acquisition at auctions held after assets have been foreclosed, mainly in relation to mortgage loans; ii) acquisition of mortgaged real estate assets of individuals, with the subsequent subrogation and cancellation of the debts; and iii) acquisition of real estate assets of companies, mainly real estate developers, to cancel their debts.
The acquisition process includes conducting full legal and technical reviews of the properties using the committees appointed for such purpose.
In all cases, purchase prices are based on appraisals performed by appraisal firms approved by the Bank of Spain and in accordance with the parameters set forth in the approved internal rules.
The strategies undertaken for the sale of these assets are as follows:
- Individual sale: through Servihabitat Servicios Inmobiliarios, with which there is a servicing contract until 31 December 2023, for multi-channel marketing activities via its own branches, the external collaboration of the network of real-estate agents and an active presence on the Internet. This marketing activity comes in addition to a key factor: support in prescribing properties generated by the branch network.
- Institutional sales: the Group takes into account institutional operations of sales of asset portfolios to other specialised companies.
- Completion of housing developments: a number of minor measures to improve some of these developments are made to ensure they can be sold. These measures are performed using the synergies of the Group.
- Rental: it is a means of benefiting from rising demand and generating recurring income, as well as creating added value on the property in the event of its future sale.
The table below shows foreclosed assets by source and type of property:
Foreclosed real estate assets - 31-12-2020(*) (Millions of euros)
| |
GROSS CARRYING AMOUNT |
ALLOWANCES FOR IMPAIRMENT (**) |
OF WHICH: FROM FORECLOSURE |
NET CARRYING AMOUNT |
| Real estate acquired from loans to real estate constructors and developers |
1,324 |
(431) |
(218) |
893 |
|
Buildings and other completed constructions |
1,188 |
(371) |
(189) |
817 |
|
|
Homes |
1,042 |
(313) |
(159) |
729 |
|
|
Other |
146 |
(58) |
(30) |
88 |
|
Buildings and other constructions under construction |
29 |
(16) |
(9) |
13 |
|
|
Homes |
14 |
(8) |
(3) |
6 |
|
|
Other |
15 |
(8) |
(6) |
7 |
|
Land |
107 |
(44) |
(20) |
63 |
|
|
Consolidated urban land |
41 |
(18) |
(7) |
23 |
|
|
Other land |
66 |
(26) |
(13) |
40 |
| Real estate acquired from mortgage loans to homebuyers |
2,218 |
(611) |
(314) |
1,607 |
| Other real estate assets or received in lieu of payment of debt |
417 |
(141) |
(53) |
276 |
| TOTAL |
3,959 |
(1,183) |
(585) |
2,776 |
(*) Includes foreclosed assets classified as "Tangible assets – Investment property" amounting to EUR 1,748 million, net, and includes foreclosure rights deriving from auctions in the amount of EUR 98 million, net. Excludes foreclosed assets of Banco BPI, with a gross carrying amount of EUR 8 million, as this is not included in business in Spain.
(**) Cancelled debt associated with the foreclosed assets totalled EUR 4,792 million and total write-downs of this portfolio amounted to EUR 2,114 million, EUR 1,183 million of which are impairment allowances recognised in the balance sheet.
Foreclosed real estate assets - 31-12-2019(*)(Millions of euros)
| |
GROSS CARRYING AMOUNT |
ALLOWANCES FOR IMPAIRMENT ** |
OF WHICH: FROM FORECLOSURE |
NET CARRYING AMOUNT |
| Real estate acquired from loans to real estate constructors and developers |
1,534 |
(438) |
(199) |
1,096 |
|
Buildings and other completed constructions |
1,396 |
(376) |
(174) |
1,020 |
|
Buildings and other constructions under construction |
29 |
(16) |
(8) |
13 |
|
Land |
109 |
(46) |
(17) |
63 |
| Real estate acquired from mortgage loans to homebuyers |
2,322 |
(542) |
(237) |
1,780 |
| Other real estate assets or received in lieu of payment of debt |
462 |
(143) |
(46) |
319 |
| TOTAL |
4,318 |
(1,123) |
(482) |
3,195 |
(*) Includes foreclosed assets classified as “Tangible assets – Investment property” amounting to EUR 2,094 million, net, and includes foreclosure rights deriving from auctions in the amount of EUR 142 million, net. Excludes foreclosed assets of Banco BPI, with a gross carrying amount of EUR 4 million, as this is not included in business in Spain.
(**) Cancelled debt associated with the foreclosed assets totalled EUR 5,450 million and total write-downs of this portfolio amounted to EUR 2,257 million, EUR 1,124 million of which are impairment allowances recognised in the balance sheet.
Foreclosed real estate assets - 31-12-2018(*) (Millions of euros)
| |
GROSS CARRYING AMOUNT |
ALLOWANCES FOR IMPAIRMENT** |
OF WHICH: FROM FORECLOSURE |
NET CARRYING AMOUNT |
| Real estate acquired from loans to real estate constructors and developers |
1,787 |
(494) |
(215) |
1,293 |
|
Buildings and other completed constructions |
1,646 |
(435) |
(193) |
1,211 |
|
Buildings and other constructions under construction |
29 |
(16) |
(9) |
13 |
|
Land |
112 |
(43) |
(13) |
69 |
| Real estate acquired from mortgage loans to homebuyers |
2,314 |
(496) |
(201) |
1,818 |
| Other real estate assets or received in lieu of payment of debt |
468 |
(146) |
(46) |
321 |
| TOTAL |
4,569 |
(1,136) |
(462) |
3,432 |
(*) Includes foreclosed assets classified as "Tangible assets – Investment property" amounting to EUR 2,479 million, net, and includes foreclosure rights deriving from auctions in the amount of EUR 213 million, net. Excludes foreclosed assets of Banco BPI, with a gross carrying amount of EUR 27 million, as this is not included in business in Spain.
(**) Cancelled debt associated with the foreclosed assets totalled EUR 5,852 million and total write-downs of this portfolio amounted to EUR 2,420 million, EUR 1,136 million of which are impairment allowances recognised in the balance sheet.
Refinancing policies
The Group has a detailed customer debt Refinancing and Recovery Corporate Policy that contains the same general principles issued by the EBA for this type of operation.
The risk management procedures and policies applied allow for detailed monitoring of credit transactions. In this regard, any transaction uncovered whose terms may need to be changed due to evidence of impairment of the borrower’s solvency is marked appropriately so the associated accounting classification and provision for impairment at the date of the change is made. Therefore, as these transactions are correctly classified and valued according to the Group’s best judgement, no additional provisions emerge in relation to the impairment of refinanced loans.
Refinancing
The breakdown of refinancing by economic sector is as follows:
Refinancing operations - 31-12-2020 (Millions of euros)
| |
WITHOUT COLLATERAL |
|
WITH COLLATERAL |
IMPAIRMENT DUE TO CREDIT RISK (*) |
| |
NO. OF OPS. |
GROSS CARRYING AMOUNT |
|
NO. OF OPS. |
GROSS CARRYING AMOUNT |
MAXIMUM AMOUNT OF THE COLLATERAL |
|
MORTGAGE COLLATERAL |
OTHER COLLATERAL |
| Public administrations |
16 |
161 |
|
340 |
47 |
43 |
0 |
0 |
| Other financial corporations and individual entrepreneurs (financial business) |
38 |
3 |
|
6 |
1 |
1 |
0 |
(1) |
| Non-financial corporations and individual entrepreneurs (non-financial business) |
4,422 |
1,418 |
|
8,741 |
1,302 |
962 |
19 |
(816) |
|
Of which: Financing for real estate construction and development (including land) |
155 |
30 |
|
2,507 |
454 |
355 |
0 |
(99) |
| Other households |
35,826 |
325 |
|
70,445 |
3,617 |
2,947 |
6 |
(831) |
| TOTAL |
40,302 |
1,907 |
|
79,532 |
4,967 |
3,953 |
25 |
(1,648) |
| Of which: in Stage 3 |
|
|
|
|
|
|
|
|
| Public administrations |
13 |
2 |
|
147 |
0 |
0 |
0 |
0 |
| Other financial corporations and individual entrepreneurs (financial business) |
31 |
1 |
|
6 |
1 |
1 |
0 |
(1) |
| Non-financial corporations and individual entrepreneurs (non-financial business) |
3,318 |
796 |
|
7,575 |
839 |
606 |
12 |
(758) |
|
Of which: Financing for real estate construction and development (including land) |
121 |
28 |
|
2,033 |
223 |
171 |
0 |
(71) |
| Other households |
22,006 |
221 |
|
52,538 |
2,936 |
2,312 |
5 |
(805) |
| TOTAL STAGE 3 |
25,368 |
1,020 |
|
60,266 |
3,776 |
2,919 |
17 |
(1,564) |
Memorandum items: Financing classified as non-current assets held for sale (*)
(*) Corresponds to "Non-current assets and disposal groups classified as held for sale".
Refinancing operations 31-12-2019 (Millions of euros)
| |
WITHOUT COLLATERAL |
|
WITH COLLATERAL |
IMPAIRMENT DUE TO CREDIT RISK (*) |
| |
NO. OF OPS. |
GROSS CARRYING AMOUNT |
|
NO. OF OPS. |
GROSS CARRYING AMOUNT |
MAXIMUM AMOUNT OF THE COLLATERAL |
|
MORTGAGE COLLATERAL |
OTHER COLLATERAL |
| Public administrations |
23 |
179 |
|
415 |
68 |
47 |
0 |
(5) |
| Other financial corporations and individual entrepreneurs (financial business) |
36 |
3 |
|
7 |
1 |
1 |
0 |
(1) |
| Non-financial corporations and individual entrepreneurs (non-financial business) |
4,387 |
1,741 |
|
10,665 |
1,660 |
1,269 |
36 |
(1,007) |
|
Of which: Financing for real estate construction and development (including land) |
256 |
69 |
|
3,062 |
587 |
438 |
0 |
(153) |
| Other households |
37,144 |
350 |
|
86,261 |
4,521 |
3,816 |
8 |
(847) |
| TOTAL |
41,590 |
2,273 |
|
97,348 |
6,250 |
5,133 |
44 |
(1,860) |
| Of which: in Stage 3 |
|
|
|
|
|
|
|
|
| Public administrations |
13 |
3 |
|
137 |
12 |
7 |
0 |
(5) |
| Other financial corporations and individual entrepreneurs (financial business) |
26 |
1 |
|
6 |
1 |
1 |
0 |
(1) |
| Non-financial corporations and individual entrepreneurs (non-financial business) |
2,604 |
917 |
|
7,086 |
887 |
637 |
13 |
(917) |
|
Of which: Financing for real estate construction and development (including land) |
175 |
55 |
|
1,905 |
277 |
194 |
0 |
(118) |
| Other households |
19,218 |
212 |
|
50,986 |
2,854 |
2,259 |
4 |
(770) |
| TOTAL STAGE 3 |
21,861 |
1,133 |
|
58,215 |
3,754 |
2,904 |
17 |
(1,693) |
Memorandum items: Financing classified as non-current assets held for sale (*)
(*) Corresponds to "Non-current assets and disposal groups classified as held for sale".
Refinancing operations 31-12-2018 (Millions of euros)
| |
WITHOUT COLLATERAL |
|
WITH COLLATERAL |
IMPAIRMENT DUE TO CREDIT RISK (*) |
| |
NO. OF OPS. |
GROSS CARRYING AMOUNT |
|
NO. OF OPS. |
GROSS CARRYING AMOUNT |
MAXIMUM AMOUNT OF THE COLLATERAL |
|
MORTGAGE COLLATERAL |
OTHER COLLATERAL |
| Public administrations |
51 |
145 |
|
445 |
73 |
40 |
0 |
(10) |
| Other financial corporations and individual entrepreneurs (financial business) |
42 |
19 |
|
7 |
2 |
2 |
0 |
(13) |
| Non-financial corporations and individual entrepreneurs (non-financial business) |
5,360 |
2,004 |
|
11,483 |
2,547 |
1,748 |
17 |
(1,531) |
|
Of which: Financing for real estate construction and development (including land) |
416 |
113 |
|
3,288 |
894 |
628 |
2 |
(294) |
| Other households |
37,914 |
360 |
|
92,879 |
5,013 |
4,235 |
10 |
(947) |
| TOTAL |
43,367 |
2,528 |
|
104,814 |
7,635 |
6,025 |
27 |
(2,501) |
| Of which: in Stage 3 |
|
|
|
|
|
|
|
|
| Public administrations |
13 |
6 |
|
144 |
15 |
3 |
0 |
(10) |
| Other financial corporations and individual entrepreneurs (financial business) |
29 |
13 |
|
6 |
1 |
1 |
0 |
(13) |
| Non-financial corporations and individual entrepreneurs (non-financial business) |
3,207 |
1,174 |
|
7,481 |
1,661 |
957 |
8 |
(1,430) |
|
Of which: Financing for real estate construction and development (including land) |
289 |
78 |
|
2,007 |
559 |
340 |
2 |
(264) |
| Other households |
20,507 |
235 |
|
53,896 |
3,094 |
2,432 |
5 |
(868) |
| TOTAL STAGE 3 |
23,756 |
1,428 |
|
61,527 |
4,771 |
3,393 |
13 |
(2,321) |
Memorandum items: Financing classified as non-current assets held for sale (*)
(*) Corresponds to "Non-current assets and disposal groups classified as held for sale".
Concentration risk
In the Corporate Risk Catalogue, concentration risk is included within credit risk, since it is the main risk source, although it covers all types of assets, as recommended by sector supervisors and they carry out best practices.
The Group has developed mechanisms to systematically identify its overall exposure. Wherever it is considered necessary, limits on relative exposures have been defined, under the RAF.
Concentration in customers or in “major risks”
The Group monitors compliance with the regulatory limits (25% of eligible own funds) and the risk appetite thresholds. At year-end, no breach of the defined thresholds had been observed.
Geographical and counterparty concentration
The Group monitors a full perspective of accounting positions, segregated by product and issuer/counterparty, classified under loans and advances, debt securities, equity instruments, derivatives and guarantees given, that complement the other positions of the Group and of the secured investment and pension funds.
Risk by geographic area is as follows:
Concentration by geographical location (Millions of euros)
| |
TOTAL |
SPAIN |
PORTUGAL |
REST OF THE EUROPEAN UNION |
AMERICA |
REST OF THE WORLD |
| Central banks and credit institutions |
64,791 |
49,317 |
5,187 |
5,000 |
906 |
4,381 |
| Public administrations |
110,306 |
93,049 |
5,431 |
11,131 |
269 |
426 |
|
Central government |
88,336 |
75,509 |
1,220 |
11,131 |
95 |
381 |
|
Other public administrations |
21,970 |
17,540 |
4,211 |
0 |
174 |
45 |
| Other financial corporations and individual entrepreneurs (financial business) |
18,346 |
8,484 |
561 |
6,105 |
2,038 |
1,158 |
| Non-financial corporations and individual entrepreneurs (non-financial business) |
122,939 |
86,853 |
11,743 |
12,423 |
6,911 |
5,009 |
|
Real estate construction and development (including land) |
5,484 |
5,319 |
164 |
0 |
0 |
1 |
|
Civil engineering |
5,852 |
4,274 |
732 |
146 |
659 |
41 |
|
Other |
111,603 |
77,260 |
10,847 |
12,277 |
6,252 |
4,967 |
|
|
Large corporates |
70,269 |
43,957 |
4,991 |
11,379 |
5,603 |
4,339 |
|
|
SMEs and individual entrepreneurs |
41,334 |
33,303 |
5,856 |
898 |
649 |
628 |
| Other households |
113,811 |
99,122 |
13,385 |
335 |
153 |
816 |
|
Homes |
88,739 |
75,701 |
11,850 |
304 |
135 |
749 |
|
Consumer lending |
16,184 |
14,718 |
1,399 |
21 |
8 |
38 |
|
Other purposes |
8,888 |
8,703 |
136 |
10 |
10 |
29 |
| TOTAL 31-12-2020 |
430,193 |
336,825 |
36,307 |
34,994 |
10,277 |
11,790 |
| TOTAL 31-12-2019 |
367,845 |
282,852 |
30,650 |
41,021 |
9,119 |
4,203 |
| TOTAL 31-12-2018 |
364,807 |
285,656 |
29,774 |
38,070 |
7,143 |
4,164 |
The breakdown of risk in Spain by Autonomous Community is as follows:
Concentration by autonomous community (Millions of euros)
| |
TOTAL |
ANDALUSIA |
BALEARIC ISLANDS |
CANARY ISLANDS |
CASTILE-LA MANCHA |
CASTILE-LEON |
CATALONIA |
MADRID |
NAVARRE |
VALENCIAN COMMUNITY |
BASQUE COUNTRY |
REST* |
| Central banks and credit institutions |
49,317 |
47 |
|
|
1 |
|
813 |
46,980 |
|
261 |
845 |
370 |
| Public administrations |
93,049 |
2,352 |
911 |
1,333 |
827 |
315 |
2,166 |
4,458 |
491 |
1,841 |
675 |
2,171 |
|
Central government |
75,509 |
|
|
|
|
|
|
|
|
|
|
|
|
Other public administrations |
17,540 |
2,352 |
911 |
1,333 |
827 |
315 |
2,166 |
4,458 |
491 |
1,841 |
675 |
2,171 |
| Other financial corporations and individual entrepreneurs (financial business) |
8,484 |
172 |
2 |
9 |
2 |
28 |
1,534 |
6,373 |
11 |
95 |
183 |
75 |
| Non-financial corporations and individual entrepreneurs (non-financial business) |
86,853 |
6,866 |
3,272 |
2,730 |
1,510 |
1,925 |
18,856 |
32,369 |
1,548 |
5,718 |
4,340 |
7,719 |
|
Real estate construction and development (including land) |
5,319 |
576 |
152 |
196 |
34 |
182 |
1,367 |
1,965 |
109 |
333 |
233 |
172 |
|
Civil engineering |
4,274 |
349 |
90 |
125 |
86 |
97 |
850 |
1,655 |
125 |
245 |
173 |
479 |
|
Other |
77,260 |
5,941 |
3,030 |
2,409 |
1,390 |
1,646 |
16,639 |
28,749 |
1,314 |
5,140 |
3,934 |
7,068 |
|
|
Large corporates |
43,957 |
1,180 |
1,784 |
1,016 |
367 |
432 |
7,549 |
23,326 |
481 |
2,058 |
2,699 |
3,065 |
|
|
SMEs and individual entrepreneurs |
33,303 |
4,761 |
1,246 |
1,393 |
1,023 |
1,214 |
9,090 |
5,423 |
833 |
3,082 |
1,235 |
4,003 |
| Other households |
99,122 |
16,146 |
3,865 |
5,624 |
2,431 |
3,411 |
29,112 |
14,833 |
2,979 |
7,936 |
3,261 |
9,524 |
|
Homes |
75,701 |
11,674 |
3,035 |
4,496 |
1,892 |
2,724 |
21,546 |
11,910 |
2,437 |
6,045 |
2,663 |
7,279 |
|
Consumer lending |
14,718 |
2,668 |
537 |
865 |
341 |
402 |
4,800 |
1,672 |
331 |
1,251 |
383 |
1,468 |
|
Other purposes |
8,703 |
1,804 |
293 |
263 |
198 |
285 |
2,766 |
1,251 |
211 |
640 |
215 |
777 |
| TOTAL 31-12-2020 |
336,825 |
25,583 |
8,050 |
9,696 |
4,771 |
5,679 |
52,481 |
105,013 |
5,029 |
15,851 |
9,304 |
19,859 |
| TOTAL 31-12-2019 |
282,852 |
24,366 |
6,849 |
8,569 |
4,063 |
5,574 |
52,526 |
68,108 |
4,809 |
15,040 |
9,204 |
17,257 |
| TOTAL 31-12-2018 |
285,656 |
24,970 |
6,339 |
8,818 |
4,143 |
5,573 |
52,736 |
70,338 |
5,026 |
15,266 |
8,713 |
17,642 |
(*) Includes autonomous communities that combined represent no more than 10% of the total
Concentration by economic sector
Risk concentration by economic sector is subject to the RAF limits, differentiating between private business economic activities and public sector financing, and the channels of the internal report defined therein. Particularly, for the private business sector, a maximum concentration limit in any economic sector is established by aggregating the accounting positions recognised, excluding treasury repo/depo operations and those of the trading portfolio.
Loans to customers by activity were as follow (excluding advances):
Concentration by activity of loans to customers 31-12-2020 (Millions of euros)
| |
TOTAL |
OF WHICH: MORTGAGE COLLATERAL |
OF WHICH: OTHER COLLATERAL |
SECURED LOANS. CARRYING AMOUNT BASED ON LATEST AVAILABLE APPRAISAL (LOAN TO VALUE) |
| |
= 40% |
> 40% = 60% |
> 60% = 80% |
> 80% =100% |
>100% |
| Public administrations |
16,169 |
401 |
565 |
372 |
200 |
158 |
156 |
80 |
| Other financial corporations and individual entrepreneurs (financial business) |
2,392 |
479 |
236 |
495 |
169 |
49 |
1 |
1 |
| Non-financial corporations and individual entrepreneurs (non-financial business) |
103,534 |
21,622 |
5,488 |
11,023 |
7,750 |
3,830 |
2,312 |
2,195 |
|
Real estate construction and development (including land) |
5,298 |
4,816 |
50 |
1,408 |
1,660 |
1,002 |
351 |
445 |
|
Civil engineering |
5,226 |
499 |
212 |
220 |
172 |
60 |
161 |
98 |
|
Other |
93,010 |
16,307 |
5,226 |
9,395 |
5,918 |
2,768 |
1,800 |
1,652 |
|
|
Large corporates |
52,723 |
4,966 |
3,613 |
4,014 |
1,866 |
1,193 |
688 |
818 |
|
|
SMEs and individual entrepreneurs |
40,287 |
11,341 |
1,613 |
5,381 |
4,052 |
1,575 |
1,112 |
834 |
| Other households |
113,452 |
95,600 |
872 |
31,478 |
34,769 |
23,095 |
4,580 |
2,550 |
|
Homes |
88,729 |
87,638 |
261 |
27,512 |
32,298 |
21,760 |
4,163 |
2,166 |
|
Consumer lending |
16,182 |
3,027 |
378 |
1,685 |
956 |
487 |
183 |
94 |
|
Other purposes |
8,541 |
4,935 |
233 |
2,281 |
1,515 |
848 |
234 |
290 |
| TOTAL |
235,547 |
118,102 |
7,161 |
43,368 |
42,888 |
27,132 |
7,049 |
4,826 |
|
|
|
|
|
|
|
|
|
|
|
| Memorandum items: Refinancing, refinanced and restructured operations |
5,226 |
4,065 |
80 |
695 |
1,084 |
1,654 |
396 |
316 |
Concentration by activity of loans to customers 31-12-2019 (Millions of euros)
| |
TOTAL |
OF WHICH: MORTGAGE COLLATERAL |
OF WHICH: OTHER COLLATERAL |
SECURED LOANS. CARRYING AMOUNT BASED ON LATEST AVAILABLE APPRAISAL (LOAN TO VALUE) |
| |
≤ 40% |
> 40% ≤ 60% |
> 60% ≤ 80% |
> 80% ≤ 100% |
> 100% |
| Public administrations |
11,066 |
415 |
498 |
275 |
184 |
212 |
167 |
75 |
| Other financial corporations and individual entrepreneurs (financial business) |
2,504 |
437 |
844 |
1,022 |
162 |
64 |
4 |
29 |
| Non-financial corporations and individual entrepreneurs (non-financial business) |
88,801 |
21,425 |
5,582 |
10,662 |
7,876 |
3,848 |
2,517 |
2,104 |
| Other households |
118,278 |
99,814 |
1,014 |
30,709 |
36,351 |
25,758 |
5,201 |
2,809 |
| TOTAL |
220,649 |
122,091 |
7,938 |
42,668 |
44,573 |
29,882 |
7,889 |
5,017 |
|
|
|
|
|
|
|
|
|
|
|
| Memorandum items: Refinancing, refinanced and restructured operations |
6,663 |
5,275 |
123 |
1,003 |
1,288 |
1,971 |
640 |
496 |
Concentration by activity of loans to customers 31-12-2018 (Millions of euros)
| |
TOTAL |
OF WHICH: MORTGAGE COLLATERAL |
OF WHICH: OTHER COLLATERAL |
SECURED LOANS. CARRYING AMOUNT BASED ON LATEST AVAILABLE APPRAISAL (LOAN TO VALUE) |
| |
≤ 40% |
> 40% ≤ 60% |
> 60% ≤ 80% |
> 80% ≤100% |
>100% |
| Public administrations |
11,425 |
438 |
387 |
107 |
223 |
254 |
148 |
93 |
| Other financial corporations and individual entrepreneurs (financial business) |
1,540 |
363 |
583 |
617 |
239 |
79 |
9 |
2 |
| Non-financial corporations and individual entrepreneurs (non-financial business) |
81,844 |
21,578 |
4,267 |
9,247 |
7,922 |
3,995 |
2,243 |
2,438 |
| Other households |
121,149 |
103,516 |
1,078 |
30,286 |
37,734 |
28,046 |
6,001 |
2,527 |
| TOTAL |
215,958 |
125,895 |
6,315 |
40,257 |
46,118 |
32,374 |
8,401 |
5,060 |
|
|
|
|
|
|
|
|
|
|
|
| Memorandum items: Refinancing, refinanced and restructured operations |
7,662 |
6,195 |
200 |
1,156 |
1,547 |
2,279 |
797 |
616 |
Breakdown of loans and advances to customer by type (Millions of euros)
| |
31/12/2020 |
|
31/12/2019 |
|
31/12/2018 |
|
|
|
STAGE 1 |
STAGE 2 |
STAGE 3 |
|
STAGE 1 |
STAGE 2 |
STAGE 3 |
|
STAGE 1 |
STAGE 2 |
STAGE 3 |
| Loan type and status |
|
|
|
|
|
|
|
|
|
|
|
|
Public administrations |
15,784 |
371 |
22 |
|
10,625 |
413 |
40 |
|
11,042 |
358 |
48 |
|
Other financial corporations |
2,279 |
120 |
3 |
|
2,447 |
62 |
3 |
|
1,525 |
21 |
16 |
|
Loans and advances to companies and individual entrepreneurs |
93,160 |
9,943 |
3,035 |
|
82,074 |
6,010 |
2,971 |
|
73,437 |
6,788 |
4,696 |
|
|
Real estate construction and development (including land) |
8,878 |
1,472 |
565 |
|
8,711 |
1,020 |
680 |
|
8,351 |
1,211 |
1,147 |
|
|
Other companies and individual entrepreneurs |
84,282 |
8,471 |
2,470 |
|
73,363 |
4,990 |
2,291 |
|
65,086 |
5,577 |
3,549 |
|
Other households |
101,611 |
9,632 |
5,196 |
|
106,273 |
9,056 |
5,373 |
|
108,614 |
9,161 |
5,973 |
|
|
Homes |
80,177 |
6,743 |
3,347 |
|
83,794 |
6,148 |
3,434 |
|
86,065 |
6,491 |
3,943 |
|
|
Other |
21,434 |
2,889 |
1,849 |
|
22,479 |
2,908 |
1,939 |
|
22,549 |
2,670 |
2,030 |
| TOTAL |
212,834 |
20,066 |
8,256 |
|
201,419 |
15,541 |
8,387 |
|
194,618 |
16,328 |
10,733 |
Breakdown of hedges of loans and advances to customers by type (Millions of euros)
| |
31/12/2020 |
|
31/12/2019 |
|
31/12/2018 |
|
|
|
STAGE 1 |
STAGE 2 |
STAGE 3 |
|
STAGE 1 |
STAGE 2 |
STAGE 3 |
|
STAGE 1 |
STAGE 2 |
STAGE 3 |
| Public administrations |
(2) |
|
(6) |
|
(6) |
|
(6) |
|
(10) |
|
(13) |
| Other financial corporations |
(4) |
(4) |
(2) |
|
(5) |
(1) |
(2) |
|
(1) |
|
(21) |
| Loans and advances to companies and individual entrepreneurs |
(566) |
(495) |
(1,543) |
|
(257) |
(328) |
(1,669) |
|
(350) |
(410) |
(2,317) |
|
Real estate construction and development (including land) |
(47) |
(91) |
(253) |
|
(34) |
(65) |
(264) |
|
(41) |
(69) |
(503) |
|
Other companies and individual entrepreneurs |
(519) |
(404) |
(1,290) |
|
(223) |
(263) |
(1,405) |
|
(309) |
(341) |
(1,814) |
| Other households |
(348) |
(565) |
(2,074) |
|
(306) |
(379) |
(1,739) |
|
(327) |
(331) |
(1,941) |
|
Homes |
(67) |
(250) |
(1,221) |
|
(152) |
(152) |
(1,000) |
|
(164) |
(162) |
(1,212) |
|
Other |
(281) |
(315) |
(853) |
|
(154) |
(227) |
(739) |
|
(163) |
(169) |
(729) |
| TOTAL |
(920) |
(1,064) |
(3,625) |
|
(574) |
(708) |
(3,416) |
|
(688) |
(741) |
(4,292) |
| Of which: identified individually |
|
(109) |
(913) |
|
|
(92) |
(1,165) |
|
|
(148) |
(1,256) |
| Of which: identified collectively |
(920) |
(955) |
(2,712) |
|
(574) |
(616) |
(2,251) |
|
(688) |
(593) |
(3,036) |
Breakdown of loans and advances to customers according to arrears status (Millions of euros)
|
|
|
31/12/2020 |
31/12/2019 |
31/12/2018 |
| By arrears status |
|
|
|
|
Of which: default on payment of less than 30 days or up to date on payments |
235,855 |
219,934 |
215,198 |
|
Of which: default on payment between 30 and 60 days |
470 |
789 |
725 |
|
Of which: default on payment between 60 and 90 days |
383 |
267 |
304 |
|
Of which: default on payment between 90 days and 6 months |
468 |
614 |
608 |
|
Of which: default on payment between 6 months and 1 year |
786 |
800 |
764 |
|
Of which: default on payment of more than 1 year |
3,194 |
2,943 |
4,080 |
| By interest rate type |
|
|
|
|
Fixed |
87,427 |
65,265 |
55,625 |
|
Floating |
153,729 |
160,082 |
166,054 |
Concentration by economic activity
The breakdown of loans and advances to non-financial companies by economic activity is set out below:
Concentration by economic activity of non-financial companies - 31-12-2020 (Millions of euros)
| |
GROSS CARRYING AMOUNT |
OF WHICH: STAGE 3 |
HEDGING |
| Agriculture, livestock, forestry and fishing |
2,013 |
100 |
(59) |
| Mining and quarrying |
565 |
6 |
(10) |
| Manufacturing industry |
14,547 |
293 |
(299) |
| Electricity, gas, steam and air conditioning supply |
7,797 |
55 |
(94) |
| Water supply |
899 |
6 |
(15) |
| Buildings |
10,142 |
475 |
(314) |
| Wholesale and retail trade |
13,507 |
368 |
(324) |
| Transport and storage |
8,744 |
195 |
(156) |
| Accommodation and food service activities |
7,025 |
141 |
(127) |
| Information and communication |
2,444 |
61 |
(51) |
| Financial and insurance activities |
9,773 |
160 |
(176) |
| Real estate |
11,061 |
280 |
(196) |
| Professional, scientific and technical activities |
4,774 |
191 |
(153) |
| Administrative and support service activities |
2,997 |
39 |
(52) |
| Public administration and defence; compulsory social security |
947 |
0 |
(5) |
| Education |
457 |
46 |
(40) |
| Human health services and social work activities |
1,420 |
94 |
(83) |
| Arts, entertainment and recreation |
820 |
50 |
(42) |
| Other services |
1,709 |
170 |
(231) |
| TOTAL |
101,641 |
2,730 |
(2,427) |
Concentration according to credit quality
The methodology applied to assign credit ratings to fixed income issuances is based on:
- Fixed-income instruments: the regulatory banking criteria defined in the CRD IV regulation and the CRR on capital requirements, and therefore, the second best rating of all those available is used, if more than two ratings are available. In this context, for example, on 31 December 2020 and 2019, the rating of Spanish sovereign debt was A. In 2018 it was A-.
- Loan portfolio: certification of the internal classifications to the Standard & Poor's methodology.
The risk concentration according to credit quality of credit risk exposures associated with debt instruments for the Group, at the end of the financial year, is stated as follows:
Concentration according to credit quality 31-12-2020 (Millions of euors)
| |
GROUP (EXC. INSURANCE GROUP) |
|
INSURANCE GROUP *** |
| |
FA AT AMORTISED COST |
FA HELD FOR TRADING * |
FA NOT HELD FOR TRADING ** |
FA AT FV W/ CHANGES IN OTHER COMPREHENSIVE INCOME |
FINANCIAL GUARANTEES, LOAN COMMITMENTS AND OTHER COMMITMENTS GIVEN |
|
FA HELD FOR TRADING * |
AVAILABLE-FOR-SALE FA * |
LOANS AND RECEIVABLES * |
| |
LOANS AND ADVANCES TO CUSTOMERS |
DEBT SEC. |
|
| |
STAGE 1 |
STAGE 2 |
STAGE 3 |
STAGE 1 |
STAGE 2 |
STAGE 3 |
|
| AAA/AA+/AA/AA- |
29,541 |
86 |
|
394 |
10 |
|
61 |
14,684 |
24 |
|
|
|
1,083 |
|
| A+/A/A- |
26,560 |
757 |
|
16,272 |
458 |
|
13,788 |
9,629 |
116 |
|
|
463 |
53,921 |
15 |
| BBB+/BBB/BBB- |
29,818 |
1,125 |
|
5,641 |
256 |
1 |
3,876 |
22,818 |
251 |
|
|
82 |
6,393 |
61 |
| INVESTMENT GRADE |
85,919 |
1,968 |
|
22,307 |
724 |
1 |
17,725 |
47,131 |
391 |
|
|
545 |
61,397 |
76 |
| Allowances for impairment |
(292) |
(73) |
|
|
|
|
(1) |
(7) |
(3) |
|
|
|
|
|
| BB+/BB/BB- |
|
|
|
|
|
46 |
124 |
|
|
|
|
|
211 |
|
| B+/B/B- |
40,931 |
5,047 |
1 |
|
|
|
|
18,975 |
1,407 |
|
|
|
|
|
| CCC+/CCC/CCC- |
11,935 |
6,235 |
19 |
47 |
|
|
|
4,708 |
1,186 |
5 |
|
|
|
|
| No rating |
75,490 |
6,816 |
8,236 |
2,327 |
77 |
5 |
47 |
29,974 |
635 |
654 |
|
|
35 |
113 |
| NON-INVESTMENT GRADE |
128,356 |
18,098 |
8,256 |
2,374 |
77 |
51 |
171 |
53,657 |
3,228 |
659 |
|
|
246 |
113 |
| Allowances for impairment |
(628) |
(991) |
(3,625) |
(11) |
|
|
|
(50) |
(27) |
(106) |
|
|
|
|
| TOTAL |
213,355 |
19,002 |
4,631 |
24,670 |
801 |
52 |
17,895 |
100,788 |
3,619 |
659 |
|
545 |
61,643 |
189 |
Concentration according to credit quality - 31-12-2019 (Millions of euros)
| |
GROUP (EXC. INSURANCE GROUP) |
|
INSURANCE GROUP *** |
| |
FA AT AMORTISED COST |
FA HELD FOR TRADING * |
FA NOT HELD FOR TRADING ** |
FA AT FV W/ CHANGES IN OTHER COMPREHENSIVE INCOME |
FINANCIAL GUARANTEES, LOAN COMMITMENTS AND OTHER COMMITMENTS GIVEN |
|
FA HELD FOR TRADING * |
AVAILABLE-FOR-SALE FA * |
LOANS AND RECEIVABLES * |
| |
LOANS AND ADVANCES TO CUSTOMERS |
DEBT SEC. |
|
| |
STAGE 1 |
STAGE 2 |
STAGE 3 |
STAGE 1 |
STAGE 2 |
STAGE 3 |
|
| AAA/AA+/AA/AA- |
29,717 |
26 |
|
|
7 |
|
932 |
14,108 |
10 |
|
|
8 |
1,026 |
|
| A+/A/A- |
26,237 |
108 |
|
10,209 |
369 |
|
9,774 |
10,105 |
23 |
|
|
927 |
52,118 |
15 |
| BBB+/BBB/BBB- |
28,108 |
261 |
|
4,139 |
246 |
1 |
4,919 |
19,726 |
286 |
|
|
131 |
5,413 |
161 |
| INVESTMENT GRADE |
84,062 |
395 |
|
14,348 |
622 |
1 |
15,625 |
43,939 |
319 |
|
|
1,066 |
58,557 |
176 |
| Allowances for impairment |
(257) |
(3) |
|
|
|
|
(2) |
(13) |
|
|
|
|
|
|
| BB+/BB/BB- |
39,130 |
2,565 |
1 |
300 |
7 |
56 |
29 |
16,965 |
597 |
|
|
|
133 |
|
| B+/B/B- |
12,439 |
6,279 |
10 |
|
|
|
|
6,002 |
1,190 |
1 |
|
|
|
|
| CCC+/CCC/CCC- |
527 |
2,281 |
70 |
5 |
|
|
|
310 |
326 |
56 |
|
|
|
|
| No rating |
66,766 |
4,021 |
8,306 |
2,742 |
90 |
6 |
312 |
27,637 |
447 |
551 |
|
|
73 |
174 |
| NON-INVESTMENT GRADE |
118,862 |
15,146 |
8,387 |
3,047 |
97 |
62 |
341 |
50,914 |
2,560 |
608 |
|
|
206 |
174 |
| Allowances for impairment |
(317) |
(705) |
(3,416) |
(6) |
|
|
|
(33) |
(16) |
(158) |
|
|
|
|
| TOTAL |
202,350 |
14,833 |
4,971 |
17,389 |
719 |
63 |
15,964 |
94,853 |
2,879 |
608 |
|
1,066 |
58,763 |
350 |
(*) DEBT SEC.: Debt securities
(**) Compulsorily measured at fair value through profit or loss
(***) Financial assets designated at fair value through profit or loss are not included, since they mainly include investments linked to life insurance products where the investment risk is borne by the policyholder (Unit-links).
Concentration according to credit quality - 31-12-2018(Millions of euros)
| |
GROUP (EXC. INSURANCE GROUP) |
|
INSURANCE GROUP *** |
| |
FA AT AMORTISED COST |
FA HELD FOR TRADING * |
FA NOT HELD FOR TRADING ** |
FA AT FV W/ CHANGES IN OTHER COMPREHENSIVE INCOME |
FINANCIAL GUARANTEES, LOAN COMMITMENTS AND OTHER COMMITMENTS GIVEN |
|
FA HELD FOR TRADING * |
AVAILABLE-FOR-SALE FA * |
LOANS AND RECEIVABLES * |
| |
LOANS AND ADVANCES TO CUSTOMERS |
DEBT SEC. |
|
| |
STAGE 1 |
STAGE 2 |
STAGE 3 |
STAGE 1 |
STAGE 2 |
STAGE 3 |
|
| AAA/AA+/AA/AA- |
29,414 |
67 |
|
|
|
|
880 |
13,121 |
14 |
|
|
|
918 |
|
| A+/A/A- |
27,146 |
262 |
|
10,191 |
623 |
|
10,187 |
10,386 |
33 |
|
|
392 |
45,452 |
|
| BBB+/BBB/BBB- |
26,595 |
318 |
|
3,269 |
121 |
1 |
7,181 |
15,640 |
41 |
1 |
|
553 |
4,744 |
264 |
| INVESTMENT GRADE |
83,155 |
647 |
|
13,460 |
744 |
1 |
18,248 |
39,147 |
88 |
1 |
|
945 |
51,114 |
264 |
| Allowances for impairment |
(262) |
(6) |
|
|
|
|
|
(10) |
|
|
|
|
|
|
| BB+/BB/BB- |
39,503 |
1,504 |
1 |
575 |
|
54 |
37 |
16,493 |
194 |
1 |
|
|
192 |
|
| B+/B/B- |
15,011 |
4,064 |
7 |
30 |
|
|
|
5,902 |
611 |
3 |
|
|
|
8 |
| CCC+/CCC/CCC- |
621 |
2,791 |
71 |
|
|
|
|
278 |
308 |
53 |
|
|
|
|
| No rating |
58,344 |
7,322 |
10,639 |
3,000 |
11 |
90 |
38 |
24,109 |
1,174 |
665 |
|
|
39 |
382 |
| NON-INVESTMENT GRADE |
113,479 |
15,681 |
10,718 |
3,605 |
11 |
144 |
75 |
46,782 |
2,287 |
722 |
|
|
231 |
390 |
| Allowances for impairment |
(433) |
(735) |
(4,277) |
(5) |
|
|
|
(59) |
(27) |
(259) |
|
|
|
|
| TOTAL |
195,939 |
15,587 |
6,441 |
17,060 |
755 |
145 |
18,323 |
85,929 |
2,375 |
723 |
|
945 |
51,345 |
655 |
(*) DEBT SEC.: Debt securities
(**) Compulsorily measured at fair value through profit or loss
(***) Financial assets designated at fair value through profit or loss are not included, since they mainly include investments linked to life insurance products where the investment risk is borne by the policyholder (Unit-links).
Concentration according to sovereign risk
The Group’s position in sovereign debt is subject to the general risk-taking policy, which ensures that all positions taken are aligned with the target risk profile:
- The position in public, regional and local debt is subject to the general concentration and country risk limits established. Regular control procedures are in place for preventing new positions in countries in which there is a high risk concentration, unless express approval is given by the pertinent authority.
- For fixed-income securities, a framework is in place regulating the solvency, liquidity and geographic location of all of the fixed-income issues and any similar transaction implying payment in cash for the buyer and the assumption of the issuer’s credit risk or related collateral. This control is exercised during the risk acceptance phase and throughout the life of the position in the portfolio.
- Public debt positions held on the Treasury Desk are subject to the framework for market risk control and limits.
The risk associated with exposures to sovereign risk, whether direct exposure or assets with sovereign backing, is continuously monitored in view of publicly available information, which includes the ratings of public agencies. At the close of 2020, all these exposures are backed by sovereign states whose credit rating is investment grade (BBB– or higher), and no hedging is deemed to be required for these exposures.
Furthermore, as specified in the table “Maximum exposure to credit risk” in section 3.3.1 of the notes to the consolidated financial statements, at 31 December 2020, 2019 and 2018, and during the financial years ended on these dates, there are no material impairments of sovereign debt securities.
The carrying amounts of the main items related to sovereign risk exposure for the Group are set out below:
Sovereign risk exposure - 31-12-2020 (Millions of euors)
| COUNTRY |
GROUP (EXC. INSURANCE GROUP) |
|
INSURANCE GROUP (***) |
| RESIDUAL MATURITY |
FA AT AMORTISED COST |
FA HELD FOR TRADING |
FA AT FV W/ CHANGES IN OTHER COMPREHENSIVE INCOME |
FA NOT HELD FOR TRADING* |
FL HELD FOR TRADING - SHORT POSITIONS |
|
AVAILABLE-FOR-SALE FA |
FA HELD FOR TRADING |
| Spain |
Less than 3 months |
2,059 |
1 |
1,760 |
|
|
|
140 |
213 |
| Between 3 months and 1 year |
5,185 |
221 |
1,198 |
|
(8) |
|
1,689 |
132 |
| Between 1 and 2 years |
4,500 |
53 |
5,008 |
|
(52) |
|
1,358 |
|
| Between 2 and 3 years |
7,593 |
44 |
3,537 |
84 |
(49) |
|
631 |
|
| Between 3 and 5 years |
4,298 |
36 |
1,688 |
|
(37) |
|
5,166 |
|
| Between 5 and 10 years |
7,397 |
62 |
775 |
|
(53) |
|
11,092 |
|
| Over 10 years |
1,151 |
25 |
|
|
(25) |
|
31,537 |
|
| TOTAL |
32,183 |
442 |
13,966 |
84 |
(224) |
|
51,613 |
345 |
| Italy |
Between 3 months and 1 year |
100 |
2 |
|
|
|
|
200 |
|
| Between 1 and 2 years |
|
|
|
|
(3) |
|
30 |
|
| Between 2 and 3 years |
|
17 |
|
|
(11) |
|
647 |
|
| Between 3 and 5 years |
438 |
|
266 |
|
(2) |
|
318 |
|
| Between 5 and 10 years |
550 |
3 |
1,225 |
|
(4) |
|
998 |
|
| Over 10 years |
|
|
61 |
|
|
|
4,080 |
|
| TOTAL |
1,088 |
22 |
1,552 |
|
(20) |
|
6,273 |
|
| Portugal |
Less than 3 months |
7 |
20 |
50 |
|
|
|
|
128 |
| Between 3 months and 1 year |
541 |
85 |
151 |
|
|
|
2 |
4 |
| Between 1 and 2 years |
332 |
1 |
132 |
|
|
|
34 |
47 |
| Between 2 and 3 years |
617 |
8 |
|
|
|
|
23 |
|
| Between 3 and 5 years |
451 |
6 |
321 |
|
|
|
53 |
|
| Between 5 and 10 years |
834 |
32 |
|
|
(5) |
|
262 |
|
| Over 10 years |
529 |
|
|
|
|
|
|
|
| TOTAL |
3,311 |
152 |
654 |
|
(5) |
|
374 |
179 |
| Other ** |
Less than 3 months |
370 |
|
|
|
|
|
|
|
| Between 3 months and 1 year |
|
|
|
|
|
|
9 |
|
| Between 1 and 2 years |
5 |
|
1 |
|
|
|
1 |
|
| Between 2 and 3 years |
4 |
|
|
|
|
|
2 |
|
| Between 3 and 5 years |
101 |
|
|
|
|
|
2 |
|
| Between 5 and 10 years |
25 |
|
|
|
|
|
14 |
|
| Over 10 years |
78 |
|
|
|
|
|
33 |
|
| TOTAL |
583 |
|
|
|
|
|
61 |
|
| TOTAL COUNTRIES |
37,165 |
616 |
16,172 |
84 |
(249) |
|
58,321 |
524 |
| |
|
|
|
|
|
|
|
|
|
| Of which: Debt securities |
21,165 |
616 |
16,172 |
84 |
|
|
58,321 |
524 |
FA: Financial assets; FL: Financial liabilities; FV: Fair value
(*) Compulsorily measured at fair value through profit or loss
(**) Exposure to the United Kingdom is not significant
(***) Financial assets designated at fair value through profit or loss are not included, since they mainly include investments linked to life insurance products where the investment risk is borne by the policyholder (Unit-links).
Sovereign risk exposure - 31-12-2019 (Millions of euros)
| COUNTRY |
|
GROUP (EXC. INSURANCE) |
|
INSURANCE GROUP (***) |
| COUNTRY |
FA AT AMORTISED COST |
FA HELD FOR TRADING |
FA AT FV W/ CHANGES IN OTHER COMPREHENSIVE INCOME |
FA NOT DESIGNATED FOR TRADING* |
FL HELD FOR TRADING - SHORT POSITIONS |
|
AVAILABLE-FOR-SALE FA |
FA HELD FOR TRADING |
| Spain |
22,255 |
365 |
10,173 |
112 |
(348) |
|
49,977 |
487 |
| Italy |
501 |
108 |
2,509 |
|
(53) |
|
5,501 |
|
| Portugal |
1,871 |
6 |
590 |
|
|
|
166 |
506 |
| US |
|
|
923 |
|
|
|
|
|
| Other ** |
472 |
|
1 |
|
|
|
65 |
|
| TOTAL COUNTRIES |
25,099 |
479 |
14,196 |
112 |
(401) |
|
55,709 |
993 |
| |
|
|
|
|
|
|
|
|
| Of which: Debt securities |
17,389 |
479 |
14,196 |
63 |
|
|
55,709 |
993 |
FA: Financial assets; FL: Financial liabilities; FV: Fair value
(*) Compulsorily measured at fair value through profit or loss
(**) Exposure to the United Kingdom is not significant
(***) Financial assets designated at fair value through profit or loss are not included, since they mainly include investments linked to life insurance products where the investment risk is borne by the policyholder (Unit-links).
Sovereign risk exposure - 31-12-2018 (Millions of euros)
| |
GROUP (EXC. INSURANCE GROUP) |
|
INSURANCE GROUP (***) |
| COUNTRY |
FA AT AMORTISED COST |
FA HELD FOR TRADING |
FA AT FV W/ CHANGES IN OTHER COMPREHENSIVE INCOME |
FA NOT DESIGNATED FOR TRADING* |
FL HELD FOR TRADING - SHORT POSITIONS |
|
AVAILABLE-FOR-SALE FA |
FA HELD FOR TRADING |
| Spain |
22,106 |
605 |
14,194 |
273 |
(331) |
|
44,262 |
393 |
| Italy |
502 |
17 |
1,342 |
|
(16) |
|
3,959 |
2 |
| Portugal |
1,093 |
8 |
791 |
|
|
|
17 |
547 |
| US |
|
|
880 |
|
|
|
|
|
| Other ** |
380 |
|
1 |
|
|
|
67 |
|
| TOTAL COUNTRIES |
24,081 |
630 |
17,208 |
273 |
(347) |
|
48,305 |
942 |
|
|
|
|
|
|
|
|
|
|
| Of which: debt securities |
17,060 |
630 |
17,208 |
273 |
(347) |
|
48,305 |
942 |
FA: Financial assets; FL: Financial liabilities; FV: Fair value
(*) Compulsorily measured at fair value through profit or loss
(**) Exposure to the United Kingdom is not significant
(***) Financial assets designated at fair value through profit or loss are not included, since they mainly include investments linked to life insurance products where the investment risk is borne by the policyholder (Unit-links).
Information regarding financing for real estate construction and development, home purchasing, and foreclosed assets
The main data regarding financing for real estate development, home purchasing and foreclosed assets are discussed below.
Financing for real estate construction and development
The tables below show financing for real estate developers and developments, including developments carried out by non-developers (business in Spain):
Financing allocated to construction and real estate development (Millions of euros)
| |
|
|
31/12/2020 |
|
31/12/2019 |
|
31/12/2018 |
|
|
|
TOTAL AMOUNT |
OF WHICH: NON-PERFORMING |
|
TOTAL AMOUNT |
OF WHICH: NON-PERFORMING |
|
TOTAL AMOUNT |
OF WHICH: NON-PERFORMING |
| Gross amount |
5,467 |
380 |
|
5,766 |
442 |
|
6,004 |
862 |
| Allowances for impairment |
(234) |
(142) |
|
(208) |
(135) |
|
(428) |
(347) |
| CARRYING AMOUNT |
5,233 |
238 |
|
5,558 |
307 |
|
5,576 |
515 |
| Excess gross exposure over the maximum recoverable value of effective collateral |
858 |
125 |
|
848 |
148 |
|
897 |
354 |
| Memorandum items: Asset write-offs |
1,969 |
|
|
2,387 |
|
|
2,784 |
|
| Memorandum items: Loans to customers excluding public administrations (business in Spain) (carrying amount) |
193,667 |
|
|
186,645 |
|
|
185,670 |
|
The tables below show the breakdown of financing for real estate developers and developments, including developments carried out by non-developers (business in Spain), by collateral:
Financing for real estate developers and developments by collateral (Millions of euros)
| |
GROSS AMOUNT |
|
|
|
31/12/2020 |
31/12/2019 |
31/12/2018 |
| Without mortgage collateral |
548 |
562 |
477 |
| With mortgage collateral |
4,919 |
5,204 |
5,527 |
|
Buildings and other completed constructions |
3,294 |
3,370 |
3,774 |
|
|
Homes |
2,250 |
2,277 |
2,556 |
|
|
Other |
1,044 |
1,093 |
1,218 |
|
Buildings and other constructions under construction |
1,251 |
1,370 |
1,185 |
|
|
Homes |
1,158 |
1,306 |
1,056 |
|
|
Other |
93 |
64 |
129 |
|
Land |
374 |
464 |
568 |
|
|
Consolidated urban land |
193 |
351 |
346 |
|
|
Other land |
181 |
113 |
222 |
| TOTAL |
5,467 |
5,766 |
6,004 |
The following table presents financial guarantees given for real estate construction and development, including the maximum level of exposure to credit risk (i.e. the amount the Group could have to pay if the guarantee is called on).
Financial Guarantees (Millions of euros)
| |
31/12/2020 |
31/12/2019 |
31/12/2018 |
| Financial guarantees given related to real estate construction and development |
105 |
107 |
93 |
|
Amount recognised under liabilities |
|
|
0 |
The table below provides information on guarantees received for real estate development loans by classification of customer insolvency risk:
Guarantees received for real estate development transactions* (Millions of euros)
| |
31/12/2020 |
31/12/2019 |
31/12/2018 |
| Value of collateral * |
12,454 |
13,362 |
13,471 |
|
Of which: Guarantees non-performing risks |
738 |
810 |
1,383 |
(*) Reflects the maximum amount of the effective collateral that can be considered for the purposes of the impairment calculation, i.e. the estimated fair value of real estate properties based on their latest available valuation or an update of that valuation based on the applicable standard in force. In addition, the remaining collaterals are included as the current value of the collateral that has been pledged to date, not including personal guarantees.
Financing for home purchases
The breakdown of home-purchase loans (business in Spain), as well as the annual financing granted to purchase homes from credit streamlining at the end of these financial years, is as follows:
Loans granted to buyers of foreclosed homes (Millions of euors)
| |
|
2020 |
2019 |
2018 |
| Financing granted in the year |
166 |
190 |
527 |
| Average percentage financed |
94% |
92% |
90% |
Home purchase loans with mortgage at these dates by the loan-to-value (LTV) ratio, based on the latest available appraisal, are as follows:
Home purchase loans by LTV* (Millions of euros)
|
|
31/12/2020 |
|
31/12/2019 |
|
31/12/2018 |
| |
GROSS AMOUNT |
OF WHICH: NON-PERFORMING |
|
GROSS AMOUNT |
OF WHICH: NON-PERFORMING |
|
GROSS AMOUNT |
OF WHICH: NON-PERFORMING |
| Not real estate mortgage secured |
639 |
8 |
|
662 |
11 |
|
762 |
12 |
| Real estate mortgage secured, by LTV ranges ** |
73,220 |
2,775 |
|
76,658 |
2,719 |
|
79,917 |
3,103 |
|
LTV ≤ 40% |
21,989 |
221 |
|
21,717 |
207 |
|
21,374 |
224 |
|
40% < LTV ≤ 60% |
26,826 |
386 |
|
28,491 |
367 |
|
30,022 |
412 |
|
60% < LTV ≤ 80% |
17,441 |
560 |
|
18,964 |
543 |
|
20,668 |
595 |
|
80% < LTV ≤ 100% |
3,747 |
520 |
|
4,002 |
519 |
|
4,348 |
591 |
|
LTV > 100% |
3,217 |
1,088 |
|
3,484 |
1,083 |
|
3,505 |
1,281 |
| TOTAL |
73,859 |
2,783 |
|
77,320 |
2,730 |
|
80,679 |
3,115 |
(*) Includes financing for home purchases granted by subsidies Unión de Créditos para la Financiación Inmobiliaria, EFC, SAU (Credifimo) and Corporación Hipotecaria Mutual.
(**) LTV calculated according to the latest available appraisals. The ranges for non-performing transactions are updated in accordance with prevailing regulations.
Counterparty risk generated by transactions with derivatives, repos, securities lending and deferred settlement transactions
Monitoring and measurement of counterparty risk
Counterparty risk, being part of credit risk, quantifies the losses derived from the counterparty's potential default before the cash flows are definitively settled. It is calculated for transactions involving derivative instruments, repo agreements, securities lending and deferred settlement.
The approval of new transactions involving counterparty risk in the Group is subject to an internal framework that enables rapid decision-making about assuming such risk, for both financial and other counterparties. In the case of business with financial institutions, the Group has a credit approval system in place under an internal framework approved by the Global Risk Committee, in which the maximum authorised exposure to credit risk with an institutions (including counterparty risk) is determined by a complex calculation, mainly based on the institution's ratings and an analysis of its financial statements. The abovementioned framework also includes the model for determining limits and calculating consumer risk with central counterparties (CCPs). In transactions with other counterparties, including retail customers, derivative transactions relating to asset applications (loan interest rate risk hedging) are approved jointly with the application. All other transactions are approved depending on whether the assigned risk limit is met, or depending on individual analysis. Approval of transactions corresponds to the risk areas responsible for loan analysis and approval.
The definition of limits for counterparty risk is complemented by internal concentration limits, mainly for country and large exposure risks.
Counterparty risk relating to derivative transactions is quantitatively associated with the related market risk, since the amount owed by the counterparty must be calculated by reference to the market value of the contracts and their related potential value (possible changes in their future value under extreme market price conditions, based on known historical patterns of market prices). Similarly, the equivalent credit exposure for derivatives is understood as the maximum potential loss over the life of an operation that the bank might incur should the counterparty default at any time in the future. This is calculated using Monte Carlo simulation with portfolio effect and offsetting of positions, as applicable, at a 95% confidence interval, based on stochastic models incorporating the volatility of the underlying asset and all of the characteristics of the operations.
Counterparty risk exposure for repos and securities lending is calculated in the Group as the difference between the market value of the securities/cash granted to the counterparty and the market value of the securities/cash received from the counterparty as collateral, considering the applicable volatility adjustments in each case.
It also considers the mitigating effect of collateral received under Framework Collateral Agreements. In general, the methodology for calculating counterparty risk exposure described above is applied during the acceptance of new operations and in recurrent calculations on subsequent days.
Counterparty risk in the Group for financial counterparties is controlled through an integrated system that provides real-time data on the available exposure limit for any counterparty, product and maturity. For the remaining counterparties, counterparty risk is controlled through corporate applications, which contain both the limits of the lines of derivatives risk (if any) and credit exposure of derivatives and repos.
Mitigation techniques for counterparty risk
The main risk mitigation policies and techniques employed for counterparty risk with financial institutions involve:
ISDA/CMOF contracts.
Standardised contracts for global derivative operations with a counterparty. These explicitly provide for the possibility of offsetting the flows of outstanding collections and payments between the parties for all derivatives trading hedged by the contracts.
CSA contracts / CMOF appendix III
Agreements whereby each of the parties undertake to provide collateral (usually a cash deposit) as security for the net counterparty risk position arising from the derivatives traded between them, on the basis of a prior close-out netting agreement included in the clauses of the ISDA/CMOF contracts.
GMRA/ CME/ GMSLA contracts
(Repo agreements and securities lending). Agreements whereby the parties undertake to deliver collateral to each other for the net counterparty risk exposure arising from differences between the value of the sum accrued by simultaneous buying and selling of securities and the market value of the securities.
Break-up clauses
Such clauses provide for early termination of the agreement by one of the parties of its own free will, at a certain point in a contract. This mitigates counterparty risk by reducing the effective duration of the operations subject to the clause, or reducing the counterparty’s counterparty risk exposure.
Delivery-versus-payment in securities settlement systems
Systems that eliminate settlement risk with a counterparty, since clearing and settlement occur simultaneously and in an inseparable fashion. One major system is the CLS system for delivery against payment in the case of simultaneous collection and payment flows in different currencies.
Central Counterparties (CCP)
The use of CCPs in derivatives and repo transactions can mitigate the associated counterparty risk, as these entities act as intermediaries on their own account between the two parties to the transaction, thus absorbing the counterparty risk. The EMIR regulations set forth an obligation to clear certain OTC derivative contracts through these Central Counterparties, as well as to give notification of all transactions conducted.
For non-financial counterparties, the mitigation techniques for counterparty risk involve: ISDA/CMOF contracts, CSA contract/CMOF Appendix III and break-up clauses, pledges of financial guarantees and guarantees issued by counterparties with higher credit quality than the original counterparty in the operation.
The Group applies collateral agreements, mainly with financial institutions. Risk is often quantified by marking to market all outstanding transactions (normally on a daily basis). This entails revision and modification, as necessary, of the collateral delivered by the debtor. Meanwhile, the impact on collateral of a hypothetical downgrade to the Group's rating would not be significant as most of the collateral agreements do not include franchises related to its rating.
Risk associated with the investee portfolio
The risk associated with equity investments (or "investees"), which in terms of regulations is included under credit risk for investments that are not classified in the held-for-trading portfolio, but which is individually included in the Corporate Catalogue as a component of the Risk of Impairment of Other Assets, entails the possible loss or reduction in the Group's solvency through equity instruments caused by adverse movements in market prices, potential sales or investee insolvency with a medium- to long-term horizon.
The way in which each share is methodologically processed for capital consumption will depend on: i) the accounting classification of the share, for investments classified in the portfolio at fair value with changes in other comprehensive income, the calculation is carried out using the internal VaR model; and ii) the longevity strategy, for investments intended to be held on a long-term basis and, in some cases, there is a long-term link in their management, the most significant risk is credit risk, and, therefore, the PD/LGD approached is used whenever possible. If the requirements for applying the aforementioned methods are not met or there is not sufficient information, the simple risk-weight approach is applied in accordance with current regulations. Without prejudice to the foregoing, for certain cases laid down in the regulation corresponding to financial investments, the capital consumption will be subjected to deductions from own funds or a fixed weighting of 250%.
As regards management, a financial analysis and control is conducted on the main investees by specialists exclusively responsible for monitoring changes in economic and financial data and for understanding and issuing alerts in the event of changes in regulations and fluctuations in competition in the countries and sectors in which the investees operate. These analysts also interact with the Investor Relations departments of the listed investees and compile the information needed, including third-party reports (e.g. investment banks, rating agencies) needed for an overall outlook of possible risks to the value of the shareholdings.
In general, with the most significant shareholdings, both the estimates of and actual data on investees’ contributions to income and net equity (where applicable) are updated regularly. In these processes, the outlook for securities markets and analysts’ views (e.g. recommendations, target prices, ratings, etc.) are shared with Senior Management for regular comparison with the market.
COVID-19 impact
In the specific context of COVID-19 (see Note 3.1), the Group is responding to the public sector's funding needs, arising from an exceptional context, while continuing to monitor the Group's level of exposure and risk appetite in this segment.
Furthermore, in relation to the private sector in Spain, CaixaBank adds to the legislative moratoria through other chiefly sector-based agreements. The Group has also made efforts to ensure the deployment of new ICO (Spanish Official Credit Institute) guarantee facilities under Royal Decree-Law 8/2020 and 25/2020, which CaixaBank also extends using working capital facilities and special funding facilities, among others9.
Other extraordinary provisions implemented by the Group are those arising from Royal Decree-Law 25/2020 and Royal Decree-Law 26/2020 on adopting urgent measures to support economic and employment reactivation, with the former having a special focus on the tourism and automobile sector, and the latter concentrating on transport and housing. They provide economic measures covering a new line of guarantees for companies and self-employed workers aimed at specific moratoria and investments (financing of property pertaining to tourist activity, of vehicles used for public transportation of bus passengers and public transportation of goods, and others). Furthermore, Royal Decree-Law 26/2020 extends the application period for mortgage and non-mortgage moratoria (Royal Decree-Law 8/2020 and Royal Decree-Law 11/2020) up to 29 September 2020, provided that the debtor is in an unexpected situation of vulnerability.
Originally, the period established for granting these guarantees ended on 31 December 2020, in accordance with the initial provisions of European Union regulations on State Aids. However, in the fourth amendment to the Temporary Framework of State Aid, the European Union extended the availability period of guarantees released under the scheme until 30 June 2021, having aligned the Spanish regulation to this new term through RDL 34/2020, which establishes the same date of 30 June 2021 as the deadline for granting public guarantees to meet the liquidity needs of self-employed workers and businesses, thus amending the provisions of RDL 8/2020, of 17 March, and RDL 25/2020, of 3 July. Furthermore, RDL 34/2020 foresees the extension, for debtors that meet certain requirements, of up to 3 additional years on the maximum maturity term of the loans with public guarantees granted under RDL 8/2020, which will be accompanied by an extension for the same term of the public guarantee (provided that the guaranteed operation total does not exceed 8 years from the operation's initial formalisation date). The new loans granted subsequently under this scheme will also have an extended maximum term of up to 8 years. With respect to the loans with guarantees released under RDL 8/2020 and RDL 25/2020, it also extends the grace period on the payment of the guaranteed loan's principal for a maximum of 12 months, thus establishing a total grace period of 24 months.
In the case of Portugal, BPI has also applied its own extraordinary measures to handle the impact of COVID-19, approved under the scope of Decree-Law 10-J/2020, issued by the Portuguese government. These measures cover actions of a similar nature to the foregoing in the Spanish context.
(9) The existence of collateral, backers or other guarantees is not grounds to avoid the classification of the operation as Stage 2, if it is deemed that it has been impaired applying the absolute and relative thresholds that the Group has established for identifying SICRs. However, these collateral, backers or other guarantees will be considered when estimating the expected losses, based on the nature and amount of the collateral or the credit quality of the backers.
The government-backed financing has been subject to a similar accounting treatment as any other financing covered by a financial guarantee; this guarantee has been considered solely for purposes of calculating the operation's expected loss. The financial guarantee has been considered an incremental cost directly attributable to the operations, which involves the accrual of a lower effective interest rate in the operation. No grant or public aid or any tax effects have been recognised under IAS 12.
The breakdown of government-backed financing operations and current moratorium applications is provided below:
Moratorium breakdown - 31-12-2020* (Millions of euros)
| |
NO. OF OPERATIONS |
|
AMOUNT |
|
CLASSIFICATION BY STAGES |
|
MATURITY |
|
|
|
|
TOTAL |
OF WHICH: SPAIN |
OF WHICH: PORTUGAL |
|
STAGE 1 |
STAGE 2 |
STAGE 3 |
|
< 6 MONTHS> |
6-12 MONTHS |
| Public administrations |
4 |
|
32 |
|
32 |
|
32 |
|
|
|
|
32 |
| Non-financial corporations and individual entrepreneurs (non-financial business) |
37,774 |
|
3,667 |
904 |
2,763 |
|
2,800 |
758 |
109 |
|
422 |
3,245 |
|
Real estate construction and development (including land) |
277 |
|
212 |
54 |
158 |
|
174 |
32 |
6 |
|
16 |
196 |
|
Civil engineering |
1,554 |
|
106 |
1 |
105 |
|
82 |
23 |
1 |
|
1 |
105 |
|
Other |
35,943 |
|
3,349 |
849 |
2,500 |
|
2,544 |
703 |
102 |
|
405 |
2,944 |
|
|
Large corporates |
1,192 |
|
559 |
156 |
403 |
|
398 |
161 |
|
|
1 |
558 |
|
|
SMEs and individual entrepreneurs |
34,751 |
|
2,790 |
693 |
2,097 |
|
2,146 |
542 |
102 |
|
404 |
2,386 |
| Other households |
183,129 |
|
10,658 |
7,834 |
2,824 |
|
6,371 |
3,720 |
567 |
|
8,867 |
1,791 |
|
Homes |
110,830 |
|
8,968 |
6,473 |
2,495 |
|
5,530 |
3,042 |
396 |
|
7,226 |
1,742 |
|
Consumer lending |
45,418 |
|
409 |
80 |
329 |
|
278 |
116 |
15 |
|
408 |
1 |
|
Other purposes |
26,881 |
|
1,281 |
1,281 |
|
|
563 |
562 |
156 |
|
1,233 |
48 |
| TOTAL CURRENT OPERATIONS |
220,907 |
|
14,357 |
8,738 |
5,619 |
|
9,203 |
4,478 |
676 |
|
9,289 |
5,068 |
|
|
|
|
|
|
|
|
|
|
|
|
|
|
|
| MORATORIUMS UNDER ANALYSIS |
21 |
|
1 |
1 |
|
|
|
|
|
|
|
|
|
|
|
|
|
|
|
|
|
|
|
|
|
|
|
| TOTAL MORATORIUMS |
220,928 |
|
14,358 |
8,739 |
5,619 |
|
|
|
|
|
|
|
(*) Including the operations of Royal Decree-Law 8/2020, Royal Decree-Law 11/2020, Royal Decree-Law 25/2020, Royal Decree-Law 26/2020, Decree-Law 10-J/2020 (Portugal) and the Sector Understanding.
Breakdown of government backed financing - 31-12-2020 (Millions of euors)
| |
SPAIN (ICO) |
PORTUGAL |
TOTAL |
| Public administrations |
6 |
|
6 |
| Non-financial corporations and individual entrepreneurs (non-financial business) |
12,634 |
551 |
13,185 |
|
Real estate construction and development (including land) |
41 |
1 |
42 |
|
Civil engineering |
974 |
36 |
1,010 |
|
Other |
11,619 |
514 |
12,133 |
|
|
Large corporates |
2,686 |
26 |
2,712 |
|
|
SMEs and individual entrepreneurs |
8,933 |
488 |
9,421 |
| TOTAL |
12,640 |
551 |
13,191 |
In this context, as regards the principles for measuring expected credit losses for the purpose of defining the credit risk loss hedges, the following considerations are noteworthy:
Processing the significant increase in credit risk (SICR):
The recurring criteria for determining the significant increase in credit risk have been strengthened, taking into account additional criteria besides those of the recurring framework. Specifically, additional criteria have been included in customers in which the company and family support mechanisms (chiefly general moratoria and state-backed financing) may have affected their classification under general criteria, either due to the lower financial burden born by the borrowers from the individuals sector, or for other reasons such as the gap between the effect of the COVID-19 and the formulation and presentation of companies' annual account. It is a temporary overlay on SIRC criteria, which will be reviewed with the evolution of the environment.
Under no circumstances has the granting of financial aid involved an improvement in the accounting classification of the exposure, and the ordinary accounting management procedures of credit impairment have not been suspended or relaxed.
Processing of the planned moratoria:
The abovementioned regulatory moratoria require financial institutions to suspend the loan payment (repayment of capital and payment of interest) for a specific period.
The government authorities have defined requirements which, in the event that they are met by the beneficiary, involve the granting of moratoria by the Group on the payment of capital or interest on the various credit operations that customers may have contracted. The specific characteristics of these programmes vary depending between Spain and Portugal:
-
In Spain the government authorities set objective criteria to grant moratoria between 3 and 6 months, depending on the operation, on the payment of capital and interest on loans with mortgage collateral, and non-mortgage credit (including credit cards). Customers that requested the application of the measure, and met and demonstrated said criteria, were provided an automatic deferral without accruing interest on the payments due during the period of suspension. Following the aforementioned period, the contract's obligations again become effective. In the case of mortgage loans, the maturity date agreed upon in the contract has been extended as a consequence of the suspension for the duration thereof, and in the case of non-mortgage credit (including credit cards), the amount of the monthly payments that were suspended will be payable once the suspension period ends.
For accounting purposes, the application of the government measures has been considered by the Group as a relevant qualitative change that has given rise to a contractual modification. In accordance with the IFRS 9 accounting framework, if the entity reviews its collection estimates (excluding changes in expected losses), it must adjust the carrying amount of the financial asset to reflect the reviewed contractual cash flows, discounting the original effective interest rate of the financial instrument. The adjustment's impact is recognised as gains or losses in the profit/(loss) for the period. Therefore, the Group has calculated this impact (generally known as modification gain and loss and including the best estimate of the operation's economic loss) and immediately recognised it in the income statement, which at 31 December 2020 amounted to EUR 48 million. This adjustment in the carrying amount of the affected financial assets is reversed throughout the 3-month or 6-month moratorium in the net interest income.
- In Portugal the government measures have also involved granting moratoriums on the capital and interest, or solely on capital, at the customer's request, to individuals (loans for home purchases) and businesses, but with two main differences with respect to Spain. Firstly, the moratoriums extend over a maximum period of 12 months, until 31 March 2021. Once this period has ended, the new payment schedule will be reviewed with the customers, extending the term of the operations by the number of months granted as moratorium. Secondly, the measures adopted in Portugal have not involved an economic loss for the Group, as interest on the deferred payments (capital and/or interest) was accrued; therefore, for accounting purposes, the contractual modification does not entail the adjustment of the financial assets' carrying amount or the recognition of any modification gain and loss.
Identification of refinanced transactions:
At the close of 31 December, the bulk of operations that underwent contractual amendments are those applying in the scope of moratoria, both legislative and sectoral, whose objective is to prevent a prolonged economic impact beyond the COVID-19 health crisis.
Given that these regulatory and sectoral moratoriums are based respectively on the application of national law and an agreement that are applied in a broad and homogeneous way in the sector, the conditions are in place in order to refrain from marking the operation as refinancing or restructuring in operations where the borrower, still having liquidity difficulties, did not have impaired capital adequacy prior to COVID-19.
The foregoing operations continue to be classified as normal (Stage 1), inasmuch as there was no reasonable doubt regarding their repayment and they would not have experienced a material increase in credit risk.
Update on the macroeconomic scenarios:
The accounting and prudential authorities have issued recommendations in relation to upholding an adequate provision level agreement considering the macroeconomic environment of heightened uncertainty generated due to COVID-19.
In this regard, the Group has taken into account different levels of severity of macroeconomic scenarios, consistent with internal planning processes (see Note 3.4.1 - Inclusion of forward-looking information in the expected loss models). These stages have been contrasted and they are aligned with those issued by public bodies, following the recommendation of the European Central Bank in its letter of 1 April 2020.
This update has involved constituting an accounting adjustment (Post Model Adjustment) in the Group – based on existing provisions models and a prudent approach – with a value of EUR 1,252 million at 31 December 2020 in the form of a generic fund. This estimate methodology is intended to be temporary (associated with the uncertainty and effects of the pandemic), it is covered under the guidelines issued by the supervisors and regulators in the environment of the pandemic, and it is backed by duly documented processes and subject to strict governance. Following on from this, this generic fund will be reviewed in the future with newly available information and reduced uncertainties regarding the real impact of the health crisis.
3.4.2Risk of impairment of other assets
Risk of impairment of other asserts is defined as the risk of a reduction in the carrying amount of shareholdings and in non-financial assets of the Group, specifically:
Investee risk:
Positions in the Group’s investee portfolio, except those over which it exercises control. These positions may arise from explicit management decisions on position-taking or from the integration of other entities, or they may result from the restructuring or execution of guarantees within what was initially a credit transaction (see note 3.4.1).
Tangible assets:
la principal contribució és la dels actius immobiliaris, tant els d'ús propi com els actius adjudicats disponibles per a la venda i lloguer. Els actius adjudicats són majoritàriament propietat de la filial immobiliària del Grup, BuildingCenter, S.A.U. En matèria de valoració dels actius adjudicats, es compleix la normativa sectorial vigent.
Intangible assets:
Mainly includes goodwill generated in business combination processes, assigned to one of the Group's cash-generating units, the software, as well as to other intangible assets with a defined useful life.
Tax assets:
Mainly deferred tax assets generated by the time differences between the balance sheet entry criteria for accounting and tax results, as well as tax credits through deductions and tax loss carryforwards generated both in the Group and in integration processes (including those that come from the integrated company itself, as well as those generated in Purchase Price Allocation exercises).
For risk management, the fulfilment of the policies is reviewed, as well as the ongoing monitoring of the various metrics, risk limits and the effective execution of the controls set out. In addition, impairment and recoverability tests and reviews are carried out using generally accepted methodologies.
3.4.3 Actuarial risk
Overview
The European regulatory framework of reference for insurance companies, known as Solvency II, is transposed into to the Spanish legal system through Act 20/2015 and Royal Decree 1060/2015, which are known, respectively, as LOSSEAR and ROSSEAR. This framework is supplemented by the technical standards approved by the European Commission (ITS), which are directly applicable, and guidelines published by EIOPA, which have been adopted by the Directorate General for Insurance and Pension Funds (DGSFP) as their own.
Actuarial risk is inherent to the activity relating to the subscription of insurance products which, within CaixaBank Group, is centralised in the subgroup of companies headed by VidaCaixa.
In line with the European Solvency II Directive, actuarial risk is defined in the Corporate Risk Catalogue as the risk of loss or adverse modification of the value of commitments taken on via insurance contracts or pensions with customers or employees, derived from the divergence between the estimate for actuarial variables employed in pricing and reserves and their real evolution.
Besides the subscription activity, actuarial risk also derives from the defined benefit pension commitments of Group companies with their employees. At CaixaBank, the risks inherent to these agreements are managed in VidaCaixa Group through the formalising of insurance contracts, whereas in Banco BPI they are implemented through a Pension Fund managed by BPI Vida e Pensões, also within VidaCaixa Group.
In general, actuarial risk management seeks to uphold the payment capacity of commitments to borrowers, optimise the technical margin and preserve the economic value of the balance sheet, within the limits established in the Risk Appetite Framework.
Actuarial risk cycle
Actuarial risk monitoring and measurement
Actuarial risk assumed in commitments is managed and controlled jointly with financial assets acquired in order to hedge them. Thus, the consideration of financial risks associated with these assets is included in the consideration of actuarial risk in a way that is consistent with the overall management of the balance sheet (asset-liabilities).
In order to ensure an adequate risk management, CaixaBank has a Corporate Financial-Actuarial Risk Management Policy in place, which sets out the corporate principles, governance framework, control framework and information reporting framework applicable to all the Group companies exposed to these risks. Furthermore, the VidaCaixa Group companies have management policies and frameworks for proprietary financial-actuarial risks that serve to implement that Corporate Policy.
Actuarial risk management established in these policies seeks the long-term stability of the actuarial factors that affect the technical evolution of subscribed insurance products. The actuarial risk factors notably feature mortality and longevity risk in the field of life insurance, where VidaCaixa includes in its management a partial internal model that provides a more adapted vision of the risk profile of the insured group, and the accident rate ratio in the fields of insurance policies other than life insurance.
On this note, and for each line of business, the VidaCaixa policy of underwriting and provision of reserves identifies various parameters for risk approval, measurement, rate-setting and, lastly, to calculate and set aside reserves covering underwritten policies. General operating procedures are also in place for underwriting and the provision of reserves.
Systems for measuring actuarial risk, from which the sufficiency of the technical provisions are quantified and assessed policy-by-policy, are integrated into the management of the insurance business. In this sense, production operations, irrespective of the channel, are recorded in the systems using the various contracting, benefits management and provision calculation applications (e.g. TAV for individual and ACO or Avanti for group insurance). Investment management software is used to manage and control the investments backing the company’s insurance activity. All of the applications are accounted for automatically in the accounting support software.
There is a series of applications that perform management support tasks within these integrated and automated systems. It is worth noting applications for data processing that are used for the preparation of reporting information and risk management. In addition, there is a solvency and risk datamart, which serves as a support tool for compliance with all the requirements of the Solvency II Directive.
In relation to interest rate risk, the Group – through its insurance company VidaCaixa – manages risk jointly considering insurance contract commitments and the affected assets, using financial immunisation techniques envisaged in the provisions of the DGSFP.
For credit and liquidity risk incurred in the insurance business, the Group has risk management frameworks that establish credit quality and diversification levels (see the risk structure of the insurance business in these fields, presented in a segmented way in Notes 3.3 and 3.5).
Mitigation of actuarial risk
One of the Group's elements used to mitigate the assumed actuarial risk consists of transferring part of the risk to other companies, through reinsurance contracts. To do so, the Group – and specifically its insurance company – has a Reinsurance Policy which is updated at least annually, which identifies the extent to which risk is passed on, taking into account the risk profile of direct insurance contracts, and the type, suitability and effectiveness of the various reinsurance agreements.
By doing so, an insurance company can reduce risk, stabilise solvency levels, use available capital more efficiently and expand its underwriting capacity. However, regardless of the reinsurance taken out, the insurance company is contractually liable for the settlement of all claims with policyholders.
Through VidaCaixa Group, the Group establishes the following via this Reinsurance Policy:
- The disclosure of the reinsurance types.
- The risk management and reporting process.
- The criteria in order to select reinsurance companies.
3.4.4 Market risk
Overview

The Group identifies market risk as the loss in value of assets or the increase in value of liabilities included in the trading portfolio due to fluctuations in interest rates, exchange rates, credit spread, external factors or prices on the markets where said assets/liabilities are traded.
Market risk encompasses almost all the Group's trading portfolio, as well as the deposits and repos arranged by trading desks for management.
Risk factors are managed according to the return-risk ratio determined by market conditions and expectations, the limits structure and the authorised operating framework.
Market risk cycle
Monitoring and measurement of market risk
On a daily basis, the responsible departments monitor the contracts traded, calculate how changes in the market will affect the positions held (daily marked-to-market results), quantify the market risk undertaken, monitor compliance with global limits and analyse the ratio of actual return to the risk undertaken. With the results obtained from these activities, they produce a daily report on position, risk quantification and the utilisation of risk thresholds, which is distributed to Senior Management, the officers in charge of its management, Model Validation and Risk and the Internal Audit division.
As a general rule, there are two types of measurements which constitute a common denominator and market standard for the measurement of market risk:
-
1.
Sensitivity
Sensitivity represents risk as the impact a slight change in risk factors has on the value of positions, without providing any assumptions about the probability of such a change.
-
2.
Value-at-risk (VaR)
The benchmark market risk measurement is VaR at 99% with a one-day time horizon for which the RAF defines a limit for trading activities of EUR 20 million (excluding the economic hedging CDS for the CVA, recognised for accounting purposes in the held-for-trading portfolio). Daily VaR is defined as the highest of the following three calculations:
- Parametric VaR with a covariance matrix deriving from a 75-day window of history, giving more weight to recent observations. The parametric VaR technique is based on volatilities and matching fluctuations in the prices and interest and exchange rates of the assets comprising the portfolio.
- Parametric VaR with a covariance matrix arising from historical performance over one year and equal weightings.
- The historical VaR technique, which calculates the impact on the value of the current portfolio of historical changes in risk factors. Daily changes observed over the last year are taken into account, with a confidence interval of 99%. Historical VaR is an extremely useful system for completing the estimates obtained by the parametric VaR technique, since it does not include any assumptions on the statistical behaviour of risk factors. The parametric VaR technique assumes fluctuations or returns that can be modelled using normal statistical distribution. Historical VaR is also an especially suitable technique since it includes non-linear relationships between the risk factors.
Moreover, since a downgrade in the credit rating of asset issuers can also give rise to adverse changes in market prices, quantification of risk is completed with an estimate of the losses arising from changes in the volatility of the credit spread on private fixed-income and credit derivative positions (spread VaR), which constitutes an estimate of the specific risk attributable to the security issuers. This calculation is made using a historical method while taking into account the potentially lower liquidity of these assets, with a confidence interval of 99%, and assuming absolute weekly variations in the simulation of credit spreads.
Total VaR results from the aggregation of VaR arising from fluctuations in interest rates, exchange rates (and the volatility of both) and from the spread VaR, which are aggregated on a conservative basis, assuming zero correlation between the two groups of risk factors, and the addition of VaR of the equities portfolio and VaR of the commodities portfolio (currently with no position), assuming in both cases a correlation of one with the other risk factor groups.
The table below shows the average 1-day VaR at 99% attributable to the various risk factors at CaixaBank. The consumption levels are moderate and are concentrated on corporate debt spread, risk in the interest rate curve, which includes the credit spread on sovereign debt, and share price volatility risk. The risk amounts for other factors have less significance.
Parametric VaR by risk factor (Millions of euros)
| |
TOTAL |
INTEREST RATE |
EXCHANGE RATE |
SHARE PRICE |
INFLATION |
COMMODITY PRICE |
CREDIT SPREAD |
INTEREST RATE VOLATILITY |
EXCHANGE RATE VOLATILITY |
SHARE PRICE VOLATILITY |
| Average VaR 2020 |
2.44 |
1.27 |
0.16 |
0.15 |
0.31 |
0 |
0.88 |
0.11 |
0.16 |
0.55 |
The highest levels, up to a maximum of EUR 6.2 million, were reached in March, due to the sharp increase of volatility in the markets as a result of the start of the health crisis arising from COVID-19 in Europe, which affected all the portfolio risk factors.
At BPI, the standard measurement for market risk is 10-day parametric VaR at 99%. In 2020, the average 1-day VaR and maximum 1-day VaR at 99% for BPI trading activities was EUR 0.06 million and EUR 0.35 million, respectively.
Additional measures to VaR
As an analysis measurement, the Group completes the VaR measurements with the following risk metrics, updated weekly:
- Stressed VaR indicates the maximum loss on adverse movements in market prices based on a stressed historical period of one year, with a 99% confidence level and a daily time horizon (subsequently extrapolated to the regulatory horizon of 10 market days, multiplying by the root of 10). The stressed VaR calculation is leveraged by the same methodology and infrastructure as the historical VaR, with the only significant difference being the historical window selected.
- The incremental default and migration risk reflects the risk related to changes in credit ratings or breach of positions in fixed-income instruments and credit derivatives in the trading portfolio, with a confidence level of 99.9%, a one-year time horizon, and a quarterly liquidity horizon, which is justified by the high liquidity of portfolio issuances. The estimate is made using Monte Carlo simulation of possible future states of external rating of the issuer and the issuance, based on transition matrices published by the main ratings agencies, where dependence between credit quality variations between the different issuers is modelled using Student’s t-distribution.
The maximum, minimum and average values of these measurements in this year, as well as their value at the close of the period of reference, are shown in the following table.
Summary of risk measurements (Millions of euros)
| |
MAXIMUM |
MINIMUM |
AVERAGE |
LAST |
| 1-day VaR |
6.5 |
0.8 |
2.4 |
3.6 |
| 1-day Stressed VaR |
11.8 |
1.8 |
4.6 |
5.6 |
| Incremental risk |
22 |
8 |
15.3 |
17.7 |
Capital requirements for market risk are determined using internal models as the sum of the 3 previous measurements, with a time horizon of 10 market days. It is displayed below:
Capital requirements (Millions of euros)
| |
LAST VALUE |
60-DAY AVERAGE |
EXCEEDED |
MULTIPLIER |
CAPITAL |
| 10-day VaR |
11.2 |
8.3 |
1 |
3 |
25 |
| 10-day Stressed VaR |
17.7 |
15.3 |
1 |
3 |
46 |
| Incremental risk |
17.7 |
14.8 |
- |
- |
17.7 |
| TOTAL (*) |
|
|
|
|
88.7 |
(*) Charges for VaR and stressed VaR are identical and correspond to the maximum between the last value and the arithmetic mean of the last 60 values, multiplied by a factor depending on the number of times the actual daily result was less than the estimated daily VaR. Similarly, capital for Incremental Risk is the maximum of the last value and the arithmetic mean of the preceding 12 weeks.
Backtesting
To confirm the suitability of the estimates of the internal model, daily results are compared against the losses estimated under the VaR technique, which is what is referred to as backtesting. The risk estimate model is checked in two ways:
- Through net or hypothetical backtesting, which relates the portion of the daily marked-to-market result of open positions at the close of the previous session to estimated VaR over a one-day time horizon, calculated on the basis of the open positions at the close of the previous session. This backtesting is the most appropriate means of performing a self-assessment of the methodology.
- Gross (or actual) backtesting, which compares the total result obtained during the day (including intraday transactions) to VaR for a time horizon of one day, calculated on the basis of the open positions at the close of the previous session. This provides an assessment of the importance of intraday transactions in generating profit and estimating the risk.
The daily result used in both backtesting exercises does not include mark-ups, reserves, fees or commissions.
An excess has been produced in gross and net backtesting during the year, due to adverse results in the equity and linear IRD desks caused by movements in the markets due to the crisis arising from COVID-19:
Distribution of net results from trading activities in 2020 (Frequency, days. Millions of euros)
Distribution of daily gross result vs. daily VaR (Millions of euros)
Distribution of daily net result vs. daily VaR (Millions of euros)
Stress test
Lastly, two stress testing techniques are used on the value of the trading positions to calculate the possible losses on the portfolio in situations of extreme stress:
- Systematic stress: this technique calculates the change in value of the portfolio in the event of a specific series of extreme changes in the main risk factors. It considers parallel interest rate shifts (rising and falling); changes at various points of the slope of the interest rate curve (steepening and flattening); variation of the spread between the instruments subject to credit risk and government debt securities (bond-swap spread); shifts in the EUR/USD curve differential; higher and lower volatility of interest rates; variation of the euro with respect to the USD, JPY and GBP; and variation in exchange rate volatility, share prices; and higher and lower volatility of shares and commodities.
- Historical scenarios: this technique addresses the potential impact of actual past situations on the value of the positions held.
- Reverse stress test: a technique that assumes a high-vulnerability scenario given the portfolio's composition and determines what variations in the risk factors lead to this situation.
Based on the set of measures described above, the management of market risk on trading positions in markets is in accordance with the methodological and monitoring guidelines.
Mitigation of market risk
As part of the required monitoring and control of the market risks taken, there is a structure of overall VaR limits complemented by the definition sublimits, stressed VaR and incremental default and migration risk, Stress Test and Stop Loss results and sensitivities for the various management units that could assume market risk.
The risk factors are managed using economic hedges on the basis of the return/risk ratio determined by market conditions and expectations, always within the assigned limits.
Beyond the trading portfolio, fair-value hedge accounting is used, which eliminates potential accounting mismatches between the balance sheet and statement of profit or loss caused by the different treatment of hedged instruments and their hedges at market values. In the area of market risk, limits for each hedge are established and monitored, in this case expressed as ratios between total risk and the risk of the hedged items.
3.4.5 Risks in the banking book
Interest rate risk in the banking book
Risk defined as the negative impact on the economic value of balance sheet items or on financial income due to changes in the temporary structure of interest rates and their impact on asset and liability instruments and those off the Group's balance sheet not recognised in the trading book.
The management of this risk by the Group seeks to i) optimise the net interest margin and ii) maintain the economic value of the balance sheet, while at all times taking into account the metrics and thresholds of the risk appetite framework in terms of volatility of the financial margin and value sensitivity.
This risk is analysed considering a broad set of market-type scenarios, including the potential impact of all possible sources of interest rate risk in the banking book, i.e. repricing risk, curve risk, basis risk and optionality risk. Optionality risk considers automatic optionality related to the behaviour of interest rates and the optionality of customer behaviour, which is not only dependent on interest rates.
The Group applies best practices in the market and the recommendations of regulators in measuring interest rate risk, using various measurement techniques that make it possible to analyse the Group's positioning and its risk situation. These include:
Static gap:
It shows the contractual distribution of maturities and interest rate reviews for applicable balance sheet or off-balance aggregates at a particular date. GAP analysis is based on comparing the values of the assets and liabilities reviewed or that mature in a particular period.
Sensitivity of net interest income:
It shows the impact on the net income caused by changes in the interest rate curve as a result of the review of balance sheet transactions. This sensitivity is determined by comparing a net interest income simulation in the event of various interest rate scenarios (immediate parallel and progressive movements of different intensities, as well as changes in slope). The most likely scenario, which is obtained using the implicit market rates, including the business trend and hedge management forecasts, is compared with other scenarios of rising or falling interest rates and parallel and non-parallel movements in the slope of the curve. The difference between these stressed net interest income figures compared to the baseline scenario give us a measure of the sensitivity, or volatility, of net interest income.
Balance sheet economic value:
it is calculated as the sum of i) the fair value of net interest-rate sensitive assets and liabilities on the balance sheet; ii) the fair value of off-balance sheet products (derivatives); and iii) the net carrying amounts of non-interest-rate sensitive asset and liability items.
Economic value sensitivity:
The economic value of sensitive balances on and off the balance sheet is reassessed under the various stress scenarios considered by the Group. The difference between this value and the economic value calculated at current market rates gives us a numeric representation of the sensitivity of economic value to the various scenarios employed.
Balance sheet VaR
Defined as the maximum economic value that could be lost from the balance sheet in a certain period of time, applying market prices and volatilities as well as correlation effects using a specific confidence level and time horizon.
The sensitivities of net interest income and economic value are measurements that complement each other and provide an overview of the interest rate risk in the banking book, which focuses more on the short and medium term, in the case of net interest income, and on the medium and long term in the case of equity.
The tables below show, using a static gap, the breakdown interest rate revaluations and maturities of sensitive items on the Group's balance sheet, without taking into account, where applicable, the value adjustments or value corrections at the year-end:
Matrix of maturities and revaluations of the balance sheet sensitive to interest rates (Millions of euros)
| |
1 YEAR |
2 YEARS |
3 YEARS |
4 YEARS |
5 YEARS |
>5 YEARS |
TOTAL |
| ASSETS |
|
|
|
|
|
|
|
| Interbank and Central Banks |
55,927 |
1,601 |
833 |
10 |
59 |
5 |
58,435 |
| Loans and advances to customers |
167,290 |
21,902 |
10,194 |
6,856 |
4,613 |
20,067 |
230,922 |
| Fixed income portfolio |
11,257 |
8,977 |
6,109 |
3,031 |
1,754 |
8,769 |
39,897 |
| TOTAL ASSETS |
234,474 |
32,480 |
17,136 |
9,897 |
6,426 |
28,841 |
329,254 |
| LIABILITIES |
|
|
|
|
|
|
|
| Interbank and Central Banks |
59,212 |
784 |
123 |
72 |
46 |
174 |
60,411 |
| Customer deposits |
109,718 |
26,152 |
15,289 |
10,537 |
8,420 |
72,492 |
242,608 |
| Issuances |
7,249 |
2,416 |
6,050 |
5,497 |
7,201 |
9,773 |
38,186 |
| TOTAL LIABILITIES |
176,179 |
29,352 |
21,462 |
16,106 |
15,667 |
82,439 |
341,205 |
| ASSETS LESS LIABILITIES |
58,295 |
3,128 |
(4,326) |
(6,209) |
(9,241) |
(53,598) |
(11,951) |
| HEDGES |
(24,135) |
7,089 |
5,613 |
3,204 |
5,897 |
2,434 |
102 |
| TOTAL DIFFERENCE |
34,160 |
10,217 |
1,287 |
(3,005) |
(3,344) |
(51,164) |
(11,849) |
Below is the sensitivity of the net interest income and economic value to sensitive balance sheet assets and liabilities for a scenario of rising and falling interest rates of 100 basis points:
Interest rate sensitivity (incremental % with respect to the market baseline scenario / implicit rates)
| |
+100 BP |
-100 BP (3) |
| Net interest income (1) |
6.70% |
0.20% |
| Economic value of equity for sensitive balance sheet aggregates (2) |
7.10% |
-6.50% |
(1) Sensitivity of the 1-year NII of sensitive balance sheet aggregates.
(2) Sensitivity of economic value for sensitive balance sheet aggregates on Tier 1.
(3) In the case of falling-rate scenarios the applied internal methodology enables the interest rates to be negative. At the current level of rates, this methodology enables the falling shock to reach approximately -1%. For example, if the interest rates of the EONIA curve are -0.40% the interest rate levels that this curve could reach, in the shock of -100 basis points, is -1.40%.
With regard to measurement tools and systems, relevant information is obtained at the transaction level of the sensitive balance sheet transactions from each computer application used to manage the various products. This information is used to produce databases with a certain amount of aggregation in order to speed up the calculations without impairing the quality or reliability of the information or results.
The assets and liabilities management application is parameterised in order to include the financial specifics of the products on the balance sheet, using behavioural customer models based on historical information (pre-payment models). The sensitivity to interest rates – conditioned by the speed with which market rates are transposed and the expected terms to maturity – have been analysed for items without a contractual maturity date (demand accounts) on the basis of past experience of customer behaviour, including the possibility that the customer may withdraw the funds invested in this type of product. For other products, in order to define the assumptions for early termination, internal models are used which include behavioural variables of customers, products, seasonality and interest rate fluctuations.
The projection tool is also fed with growth data budgeted in the financial plan (volumes, products and margins) and information on the various market scenarios (interest and exchange rate curves), in order to perform a reasonable estimate of the risks associated with the net interest income and economic value of sensitive balance sheet aggregates.
To mitigate the interest rate risk in the banking book, the Group actively manages risk by arranging additional hedging transactions on financial markets to supplement the natural hedges generated on its own balance sheet as a result of the complementarity between the sensitivity to fluctuations in interest rates on deposits and on lending transactions arranged with customers or other counterparties.
The interest rate risk in the banking book assumed by the Group is substantially below levels considered significant under current regulations.
No events with a material impact on interest rate in the banking book risk occurred during 2020. The effects arising from the loans in arrears, as a result of the economic measures taken due to the effects of the pandemic, do not have a material impact for risk purposes.
Exchange rate risk in the banking book
Exchange rate risk in the banking book corresponds to the potential risk in the assets affected by adverse movements in exchange rates.
The Group has foreign currency assets and liabilities in its balance sheet as a result of its commercial activity and its shares in foreign currencies, in addition to the foreign currency assets and liabilities deriving from the Group’s measures to mitigate exchange rate risk.
The equivalent euro value of all foreign currency assets and liabilities in the Group's balance sheet is as follows:
Foreign currency positions (Millions of euros)
|
|
|
31/12/2020 |
31/12/2019 |
31/12/2018 |
| Cash and cash balances at central banks and other demand deposits |
538 |
419 |
524 |
| Financial assets held for trading |
391 |
2,314 |
1,852 |
| Financial assets with changes in other comprehensive income |
393 |
1,352 |
1,458 |
| Financial assets at amortised cost |
13,494 |
11,206 |
8,573 |
| Equity Investments |
87 |
108 |
94 |
| Other assets |
115 |
1,060 |
1,612 |
| TOTAL FOREIGN CURRENCY ASSETS |
15,018 |
16,459 |
14,113 |
| Financial liabilities at amortised cost |
8,729 |
8,878 |
7,899 |
|
Deposits |
7,773 |
7,857 |
7,009 |
|
|
Central banks |
652 |
1,385 |
1,402 |
|
|
Credit institutions |
1,807 |
1,469 |
1,269 |
|
|
Customers |
5,314 |
5,003 |
4,338 |
|
Debt securities issued |
867 |
945 |
847 |
|
Other financial liabilities |
89 |
76 |
43 |
| Other liabilities |
(244) |
2,489 |
1,919 |
| TOTAL FOREIGN CURRENCY LIABILITIES |
8,485 |
11,367 |
9,818 |
The Group hedges its foreign currency risk by arranging cash transactions of financial derivatives, which mitigate the risk of asset and liability positions on the balance sheet. However, the nominal amount of these instruments is not reflected directly on the balance sheet but rather as memorandum items for financial derivatives. This risk is managed by seeking to minimise the level of exchange rate risk assumed in commercial activity, which explains why the Group's exposure to this market risk is low.
The remaining minor foreign currency positions in the banking book and of the treasury activity are chiefly held with credit institutions in major currencies. The methods for quantifying these positions, which are the same, are applied alongside the risk measurements used for the treasury activity as a whole.
The breakdown by currency of the main headings of the balance sheet are set out below:
Main balance sheet items by currency - 31-12-2020 (Millions of euros)
| |
|
CASH * |
FA HELD FOR TRADING |
FA WITH CHANGES IN OCI |
FA AT AMORTISED COST |
FL AT AMORTISED COST |
OTHER LIABILITIES |
| USD |
184 |
(418) |
53 |
9,024 |
6,951 |
(1,121) |
| JPY |
12 |
1 |
|
383 |
138 |
1 |
| GBP |
36 |
724 |
4 |
1,862 |
820 |
836 |
| PLN (Polish Zloty) |
155 |
|
|
718 |
391 |
1 |
| CHF |
21 |
11 |
|
203 |
111 |
1 |
| CAD |
25 |
133 |
|
735 |
69 |
87 |
| Other |
105 |
(60) |
336 |
569 |
249 |
(49) |
| TOTAL |
538 |
391 |
393 |
13,494 |
8,729 |
(244) |
FA: Financial assets; FL: Financial liabilities
(*) Cash and cash balances at central banks and other demand deposits
Given the reduced exposure to exchange rate risk and considering the existing hedges, the sensitivity of the balance sheet's economic value is not significant.