The composition of the Group’s eligible own funds is as follows:
31-12-2019 |
31-12-2018 |
31-12-2017 |
||||
|---|---|---|---|---|---|---|
Amount |
As % |
Amount |
As % |
Amount |
As % |
|
Net equity |
25,151 |
|
24,058 |
|
24,683 |
|
Shareholders’ equity |
26,247 |
|
25,384 |
|
24,722 |
|
Capital |
5,981 |
|
5,981 |
|
5,981 |
|
Profit/(loss) |
1,705 |
|
1,985 |
|
1,684 |
|
Reserves and other |
18,561 |
|
17,418 |
|
17,057 |
|
Minority interests and OCI |
(1,096) |
|
(1,326) |
|
(39) |
|
Other CET1 instruments |
(1,037) |
|
(801) |
|
(710) |
|
Adjustments applied to the eligibility of minority interests and OCI |
6 |
|
(43) |
|
(93) |
|
Other adjustments (1) |
(1,043) |
|
(758) |
|
(617) |
|
CET1 Instruments |
24,114 |
|
23,257 |
|
23,973 |
|
Deductions from CET1 |
(6,327) |
|
(6,457) |
|
(6,650) |
|
Intangible assets |
(4,232) |
|
(4,250) |
|
(4,206) |
|
Deferred tax assets |
(1,875) |
|
(1,977) |
|
(1,876) |
|
Other deductions from CET1 |
(220) |
|
(230) |
|
(568) |
|
Common Equity Tier 1 (CET1) |
17,787 |
12.0% |
16,800 |
11.5% |
17,323 |
11.7% |
AT1 instruments |
2,236 |
|
2,233 |
|
999 |
|
AT1 Deductions |
|
|
|
|
|
|
TIER 1 |
20,023 |
13.5% |
19,033 |
13.0% |
18,322 |
12.3% |
T2 instruments |
3,224 |
|
3,295 |
|
5,023 |
|
T2 Deductions |
|
|
|
|
|
|
TIER 2 |
3,224 |
2.2% |
3,295 |
2.3% |
5,023 |
3.4% |
TOTAL CAPITAL |
23,247 |
15.7% |
22,328 |
15.3% |
23,345 |
15.7% |
Other eligible subordinated instruments. MREL (5) |
5,680 |
|
2,303 |
|
1,608 |
|
SUBORDINATED MREL |
28,927 |
19.6% |
24,631 |
16.9% |
24,953 |
16.8% |
Other eligible instruments. MREL (3) |
3,362 |
|
2,943 |
|
|
|
MREL (4) |
32,289 |
21.8% |
27,574 |
18.9% |
|
|
RISK WEIGHTED ASSETS (RWA) |
147,880 |
|
145,942 |
|
148,695 |
|
(*) From 01-01-2019 the regulatory and fully-loaded data are the same. The figures at 31-12-2018 and 31-12-2017 are those expected for the end of the transitional period (fully-loaded) of the COREP statuses of each period.
(1) Mainly the forecast for dividends payable.
(2) Five senior non-preferred debt issuances have been made this year for a nominal amount of EUR 3,382 million.
(3) A senior preferred debt issuance has been made this year for a nominal amount of EUR 1,000 million.
(4) On 24 April 2019, the Bank of Spain notified CaixaBank about the MREL requirement. In accordance with this notification, CaixaBank must reach as of 1 January 2021 a volume of equity and eligible liabilities of approximately 22.5% of the RWA at a consolidated level.
At the individual level, CaixaBank has ratios of 13.8% CET1, 15.4% Tier 1 and 17.8% Total Capital, with RWAs of EUR 135,725 million.
The following chart sets out a summary of the minimum requirements of eligible own funds:
31-12-2019 |
31-12-2018 |
31-12-2017 |
||||
|---|---|---|---|---|---|---|
Amount |
As % |
Amount |
As % |
Amount |
As % |
|
BIS III minimum requirements |
|
|
|
|
|
|
CET1 (*) |
12,983 |
8.78% |
12,770 |
8.75% |
13,011 |
8.75% |
Tier 1 |
15,201 |
10.28% |
14,959 |
10.25% |
15,241 |
10.25% |
Total capital |
18,159 |
12.28% |
17,878 |
12.25% |
18,215 |
12.25% |
(*) Includes the minimum requirement of Pillar I of 4.5%; the requirement of Pillar II of 1.5%; the capital conservation buffer of 2.5%, the O-SII (Other Systemically Important Institution) buffer of 0.25%. The specific countercyclical risk buffer of 0.03% is also added during 2019.
The same requirements for 2019 are upheld in 2020, with the difference being that the countercyclical capital buffer for exposure to third-party countries must be updated quarterly.
The following chart provides a breakdown of the leverage ratio:
31-12-2019 |
31-12-2018 * |
31-12-2017 * |
|
|---|---|---|---|
Exposure |
341,681 |
344,485 |
343,484 |
Leverage ratio (Tier 1/Exposure) |
5.9% |
5.5% |
5.3% |
(*) The figures are those expected for the end of the transitional period (fully-loaded).
The changes in eligible own funds are as follows:
31-12-2019 |
31-12-2018 |
|||
|---|---|---|---|---|
Amount |
As % |
Amount |
As % |
|
CET1 at the start of the year |
16,800 |
11.5% |
17,323 |
11.7% |
Changes in CET1 instruments |
856 |
|
(715) |
|
Benefit |
1,705 |
|
1,985 |
|
Expected dividends |
(897) |
|
(1,016) |
|
Reserves |
303 |
|
(455) |
|
Minority interests |
0 |
|
(318) |
|
Valuation adjustments and other |
(255) |
|
(911) |
|
Changes in deductions from CET1 (1) |
131 |
|
192 |
|
Intangible assets |
18 |
|
(44) |
|
Deferred tax assets |
102 |
|
(101) |
|
Other deductions from CET1 |
11 |
|
337 |
|
AT1 deductions covered by CET1 |
0 |
|
0 |
|
CET1 at the end of the year |
17,787 |
12.0% |
16,800 |
11.5% |
Additional TIER 1 at the start of the year |
2,233 |
1.5% |
999 |
0.6% |
Changes in AT1 instruments |
3 |
|
1,234 |
|
Changes in deductions from CET1 |
0 |
|
0 |
|
Additional TIER 1 at the end of the year |
2,236 |
1.5% |
2,233 |
1.5% |
TIER 2 at the start of the year |
3,295 |
2.3% |
5,023 |
3.4% |
Changes in Tier 2 instruments |
(71) |
|
(1,728) |
|
Subordinated issuances |
0 |
|
1,000 |
|
Redemption of issuances |
0 |
|
(2,822) |
|
Other |
(71) |
|
94 |
|
Changes in Tier 2 deductions |
0 |
|
|
|
TIER 2 at the end of the year |
3,224 |
2.2% |
3,295 |
2.3% |
The causative details of the main aspects of the financial year that have influenced the CET1 ratio are set out below:
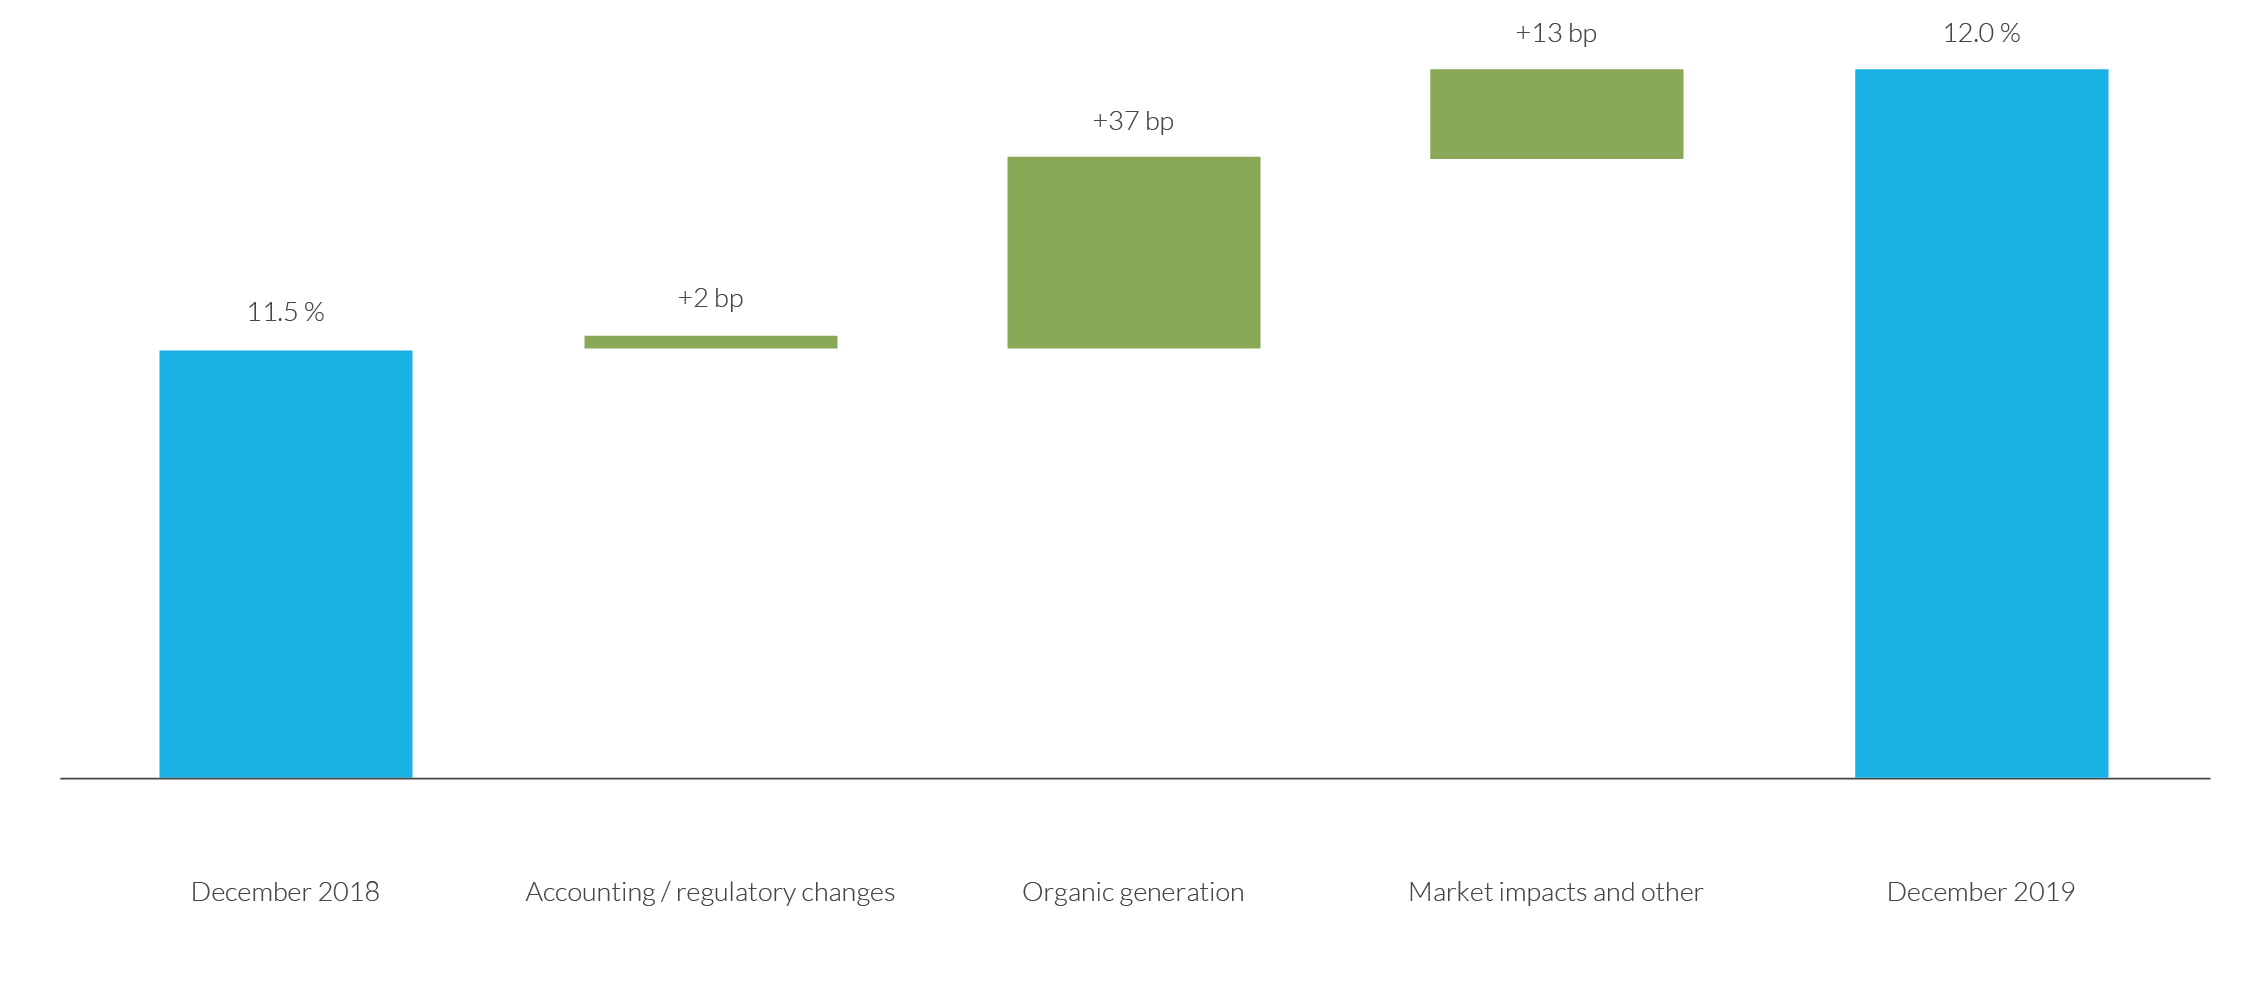
The Common Equity Tier 1 (CET1) ratio amounts to 12.0% at 31 December 2019. The organic capital generation of the year has been +37 basis points, regulatory and accounting changes have had an impact of +2 basis points (of which -11 basis points of first application of IFRS 16, +18 basis points by the change in the accounting of the commitments defined with employees and -5 basis points for the adjustment of credit risk requirements for real estate financing in accordance with applicable regulations (see Article 128 of Regulation 575/2013 "Capital Requirements Regulation" (CRR)) and +13 basis points due to the evolution of markets and other impacts.
These levels of CET1 lay the foundations for achieving the capital objective set in the 2019-2021 Strategic Plan, which stands at approximately 12%, with an additional 1 percentage point prudential buffer being established until the end of 2021 to cover any future regulatory changes, including the end of the Basel 3 framework.
Information on capital requirements by risk calculation method is presented below:
31-12-2019 |
31-12-2018 |
31-12-2017 |
||||
|---|---|---|---|---|---|---|
Amount |
As % |
Amount |
As % |
Amount |
As % |
|
Credit risk (1) |
113,947 |
77.0% |
111,740 |
76.6% |
110,819 |
74.5% |
Standardised approach |
62,069 |
42.0% |
60,612 |
41.5% |
64,172 |
43.2% |
IRB approach |
51,878 |
35.0% |
51,128 |
35.0% |
46,647 |
31.4% |
Shareholder risk |
18,309 |
12.4% |
19,177 |
13.1% |
22,614 |
15.2% |
PD/LGD method |
5,915 |
4.0% |
7,436 |
5.1% |
9,907 |
6.7% |
Simple method |
12,394 |
8.4% |
11,709 |
8.0% |
12,443 |
8.4% |
VaR method |
0 |
0.0% |
32 |
0.0% |
264 |
0.2% |
Market risk |
2,224 |
1.5% |
1,916 |
1.3% |
2,279 |
1.5% |
Standardised approach |
1,232 |
0.8% |
1,177 |
0.8% |
1,229 |
0.8% |
Internal models (IMM) |
992 |
0.7% |
739 |
0.5% |
1,050 |
0.7% |
Operational risk |
13,400 |
9.1% |
13,109 |
9.0% |
12,983 |
8.7% |
Standardised approach |
13,400 |
9.1% |
13,109 |
9.0% |
12,983 |
8.7% |
Total |
147,880 |
100.0% |
145,942 |
100.0% |
148,695 |
100.0% |
(1) Includes credit valuation adjustments (CVA), deferred tax assets (DTAs) and securitisations.