Key strategies / Attain recurring returns above the cost of capital
FINANCIAL REPORTING AND RESULTS
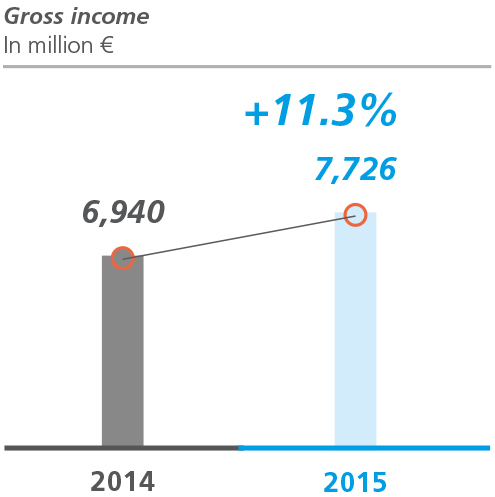
2015 was marked by a recovery in profitability, based on our commercial strength, specialisation and lower risk costs, and managing efficiency as a strategic approach.
RESULTS
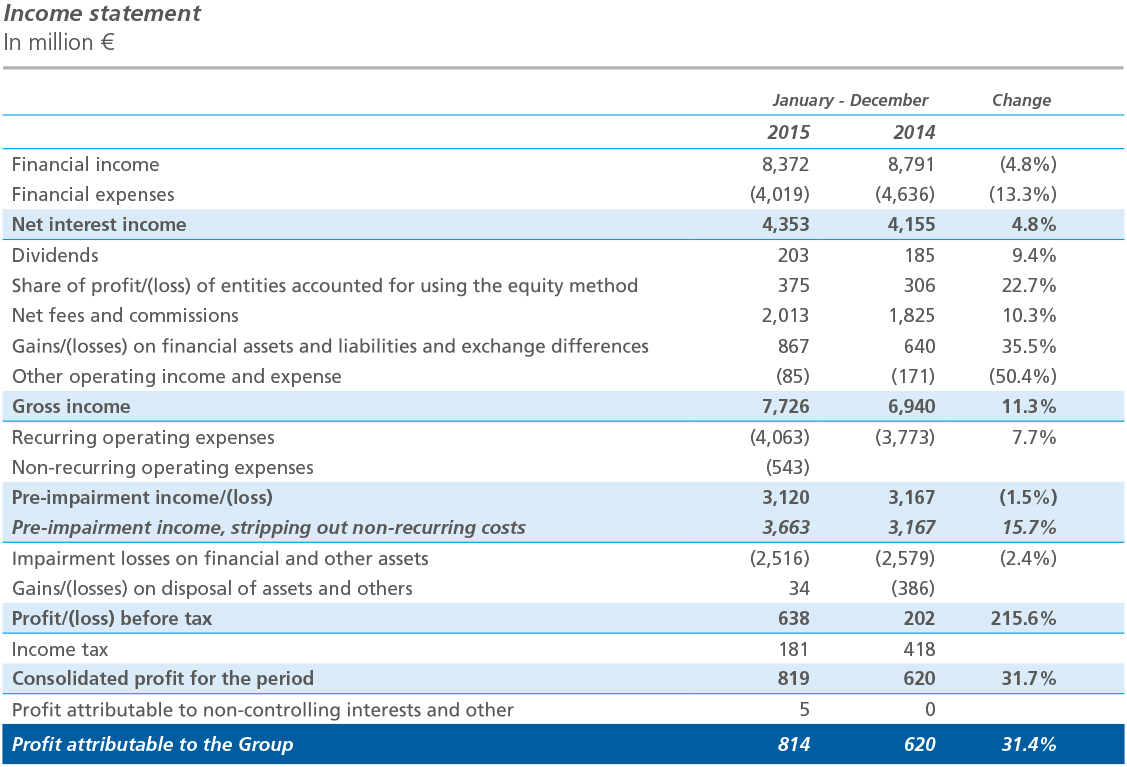
Profit attributable to the Group in 2015 stood at €814 million (up 31.4% on 2014), driven by growth in revenues, streamlined costs and lower insolvency allowances.
The inclusion of the results of Barclays Bank, SAU impacted different headings of the year-on-year income statement comparison.
Strong revenue-generating capacity
Net interest income stands at €4,353 million (+4.8% vs. 2014). This performance was marked by a decrease in the finance cost of retail savings and the contracting of interest income, mainly as a result of the drop in market rates and the reduced volume of institutional activity (fixed income).
Fee income increased by 10.3%, reaching €2,013 million, mainly as a result of the increase in assets under management in off-balance sheet products.
Earnings on the investee portfolio amounted to €578 million, up 17.7%.
Net trading income and exchange differences amounted to €867 million, resulting mainly from latent gains on available-for-sale financial assets.
“Other operating income and expenses” includes, among other items, higher income from life-risk insurance (+44.2%) and contributions to the Deposit Guarantee Fund and the National Resolution Fund.
+4.8%
net interest income vs. 2014
+10.3%
fees and commissions vs. 2014
Efficiency management as a strategic approach
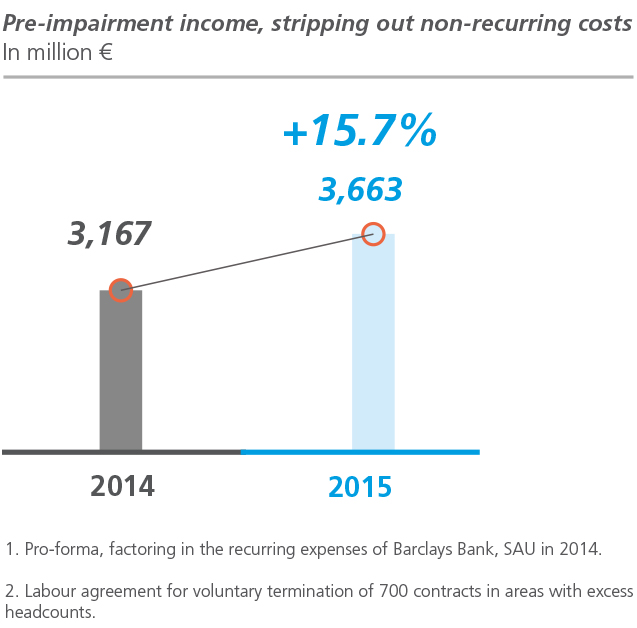
Recurrent costs on a like-for-like basis 1 were down 1.2%, as a result of our cost containment and streamlining efforts. Factoring in the integration of Barclays Bank, SAU, recurring operating expenses were up 7.7%.
Furthermore, non-recurring costs of €259 million stemming from the integration of Barclays Bank, SAU and €284 million from the labour agreement2 were reported during the year.
Recurring pre-impairment income increased by 15.7%. If we factor in non-recurring costs, pre-impairment income stood at €3,120 million (−1.5%).
The recurring cost-to-income ratio improved by 1.8 percentage points, to 52.6%.
52.6%
Cost-to-income ratio, stripping out non recurring costs –1.8 percentage points
0.7%
Cost of risk –27 basis points
Gradual improvement in credit quality and other impacts
Impairment losses on financial assets and others assets were down 2.4% due to the significant reduction in the volume of insolvency allowances (−23.6%) and the increase in other allowances, which include coverage for future contingencies and impairment losses on other assets.
“Gains (losses) on disposal of assets and other” essentially includes the profit or loss from one-off transactions carried out (including negative goodwill of €602 million on the consolidation of Barclays Bank, SAU), and the gains or losses on sales and write-downs of real-estate assets.
ACTIVITY
Leadership in banking in Spain, with high market shares across the main retail products and services.
Total assets amounted to €344,255 million (up 1.7% on 2014).
Customer funds
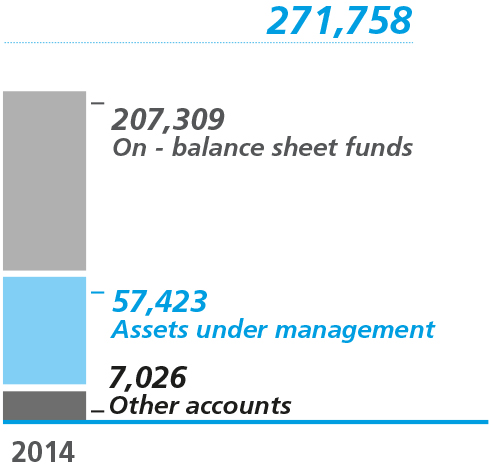
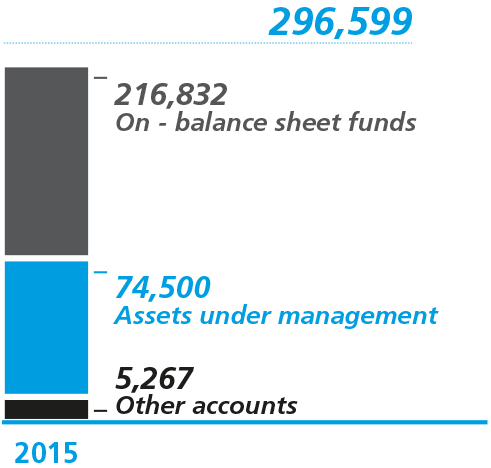
Customer funds amounted to €296,599 million (up 9.1% in 2015), following the integration of Barclays Bank, SAU and the strong commercial efforts.
Trends in balance sheet funds were impacted by customers channelling funds from saving products to off-balance sheet products and by the increase in liabilities under insurance contracts (of 6.7% in 2015) following the success of our marketing campaigns.
Assets under management (mutual funds and pension plans) amounted to €74,500 million (up 29.7% on 2014). Net fund subscriptions in 2015 amounted to €7,012 million, 28% of the sector total.
Market leadership for assets under management and the number of mutual funds participants, and pension plan assets under management.
108,000
Savings insurance, mutual funds and pension plans million €
Customer funds In million €
Loans and advances to customers
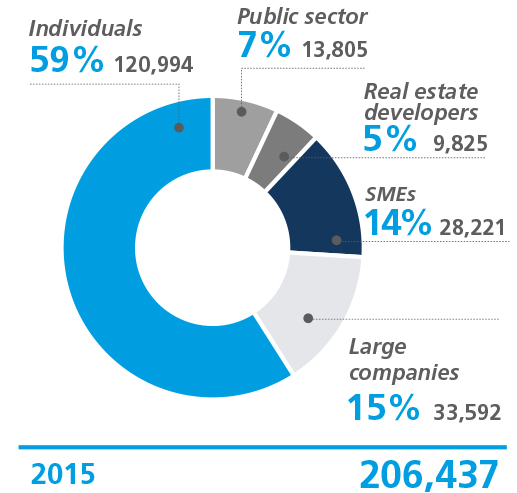
Gross customer loans and advances stood at €206,437 million (up 4.7% in 2015) following the integration of Barclays Bank, SAU, the containment of the deleveraging process and the reduced exposure to the real estate development sector.
There was a 48% increase in the production of new consumer lending following our marketing activities in the year.
In 2015, we increased lending to non-real estate businesses. The success of the CaixaNegocios and AgroBank marketing strategies enabled us to identify solid business opportunities and respond to the financing needs of customers in these segments.
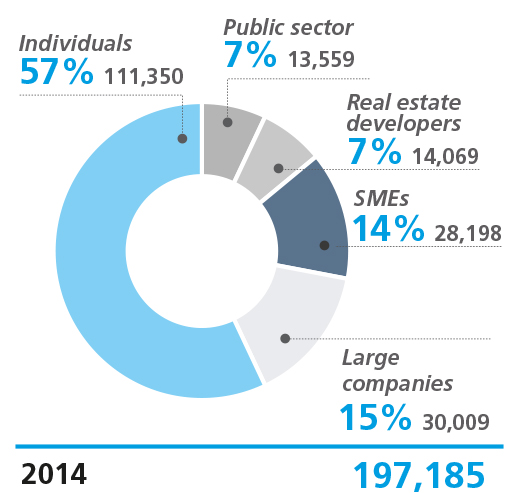
Diversification is one of the key strengths of CaixaBank‘s portfolio, 73% of which is dedicated to retail financing (individuals and SMEs).
Loan portfolio diversification Percentage of gross loans and absolute value of financing in € million
Risk management
Significant improvement in asset quality
The year saw a €5,242 million drop in non-performing loans, stripping out the impact of integrating Barclays Bank, SAU.
This brought the NPL ratio at 31 December 2015 to 7.9%, down 1.8 percentage points on year-end 2014. Stripping out the real estate development sector, the NPL ratio stands at 6.2%.
The main risk segment − lending to individuals for house purchases − features a very diversified portfolio, with good collateral and a low NPL ratio (4.0%).
Conservative risk coverage policies
The coverage ratio stood at 56%, with provisions of €9,512 million.
FINANCIAL STRENGTHS
Excellent liquidity level and solid financing structure
At 31 December 2015, banking liquidity stood at €54,090 million, all of which was immediately available (15.7% of Group assets).
The loan-to-deposits ratio stood at 106.1%, reflecting solid retail financing.
One of the Group‘s top priorities is to ensure that capital is fully optimised
At 31 December 2015, CaixaBank‘s Common Equity Tier 1 (CET1) fully loaded ratio stood at 11.55%, applying the criteria planned for the end of the phase-in period. In 2015, with a 22 basis point change in capital generation and a 78 basis point decrease due to the integration of Barclays Bank, SAU, the fully loaded leverage ratio stands at 5.2%.
Under the progressive application criteria applicable this year, CaixaBank achieved a regulatory CET1 ratio of 12.9% and a leverage ratio of 5.7%.
Risk weighted assets totalled €143,312 million. This was mainly due to the incorporation of the risk weighted assets of Barclays Bank, SAU, offset in part by deleveraging of the loan portfolio.
The ECB‘s publication of its minimum regulatory capital requirements reinforced our capital buffer and capacity to pay dividends. Our solvency resulted in a CET1 buffer of: ~205 fully-loaded basis points and ~360 regulatory basis points.
When the stake swap agreement with CriteriaCaixa3 is made, CaixaBank will meet its Strategic Plan objective of reducing capital consumption by the investee portfolio to less than 10%.
106.1%
Loan-to-deposits ratio
172%
Liquidity Coverage Ratio
11.55%
CET1 fully loaded
12.9%
CET 1
Rating at 31 December 2015
Agency
Non-current
Current
Outlook
Standard& Poor‘s
BBB
A-2
Stable
Fitch
BBB
F2
Positive
Moody‘s
Baa2
P-2
Stable
DBRS
A (low)
R-1 (low)
Positive
3. Planned swap transferring holdings in Grupo Financiero Inbursa and The Bank of East Asia to CriteriaCaixa in exchange for treasury stock and cash (the regulatory authorisations have yet to be obtained).


 PDF
PDF
 Microsite


 The Principles of the UN Global Compact covered in the page are: